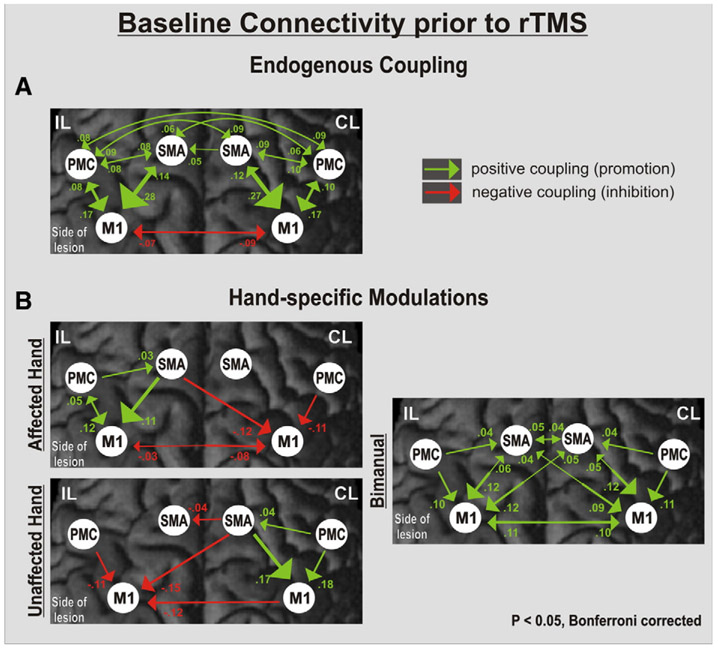
Fig. 2.
Interregional connectivity at baseline. Coupling parameters (rate constants in 1/s) indicate connection strength (changes in activation per second), which is also coded in the size and color of the arrows representing effective connectivity. Positive (green) values represent facilitatory, negative (red) values inhibitory influences on neuronal activity. The greater the absolute value (reflecting the rate constant of the observed influence in 1/s), the more predominant the effect one area has over another. (A) Endogenous coupling of motor areas irrespective of hand movements. (B) Hand-specific modulation of connections. Note the additional inhibitory coupling between contralesional (CL) M1 and ipsilesional (IL) M1 for movements of the affected hand.

