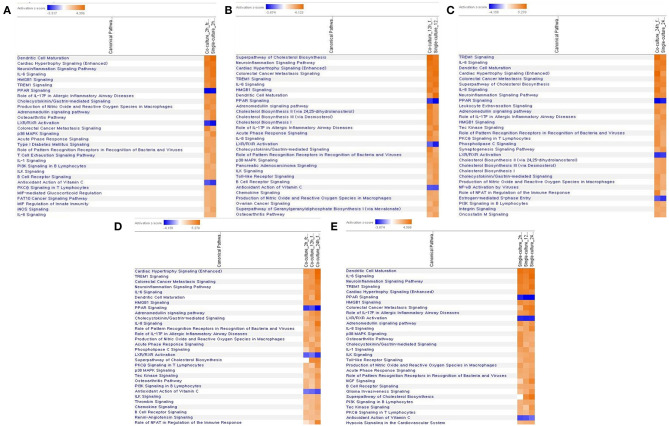
Figure 5.
Comparative analysis of canonical pathway by each model and time period by z-score value. (A) In a 2-h top 30 canonical pathway comparison analysis of each model, (B) in a 12-h top 30 canonical pathway comparison analysis of each model, (C) in a 24-h top 30 canonical pathway comparison analysis of each model, (D) comparative analysis of the canonical pathway over time in a coculture model, (E) comparative analysis of the canonical pathway over time in a single-culture model.

