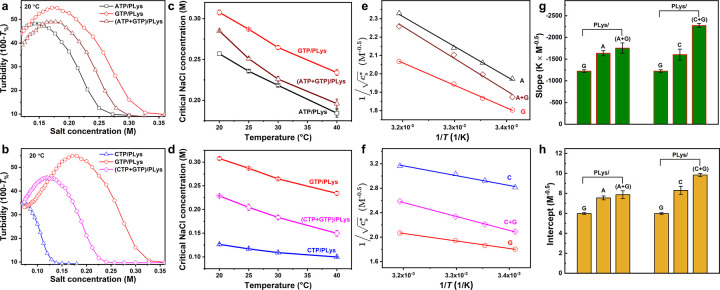
Figure 5.
UCST behavior of mixed NTP coacervates. (a) Turbidity of ATP, GTP and their mixture with PLys as a function of salt concentration. (b) Turbidity of CTP, GTP, and their mixture with PLys as a function of salt concentration. (c) Temperature dependence of the critical salt concentration (cs*) of ATP, GTP, and their combination with PLys. (d) Temperature dependence of cs of CTP, GTP, and their combination with PLys. (e, f) Linearization of (c, d) according to eq 4. (g) Slopes (−B/α) and (h) intercepts (A′) of linear fits of the data in (e) and (f).

