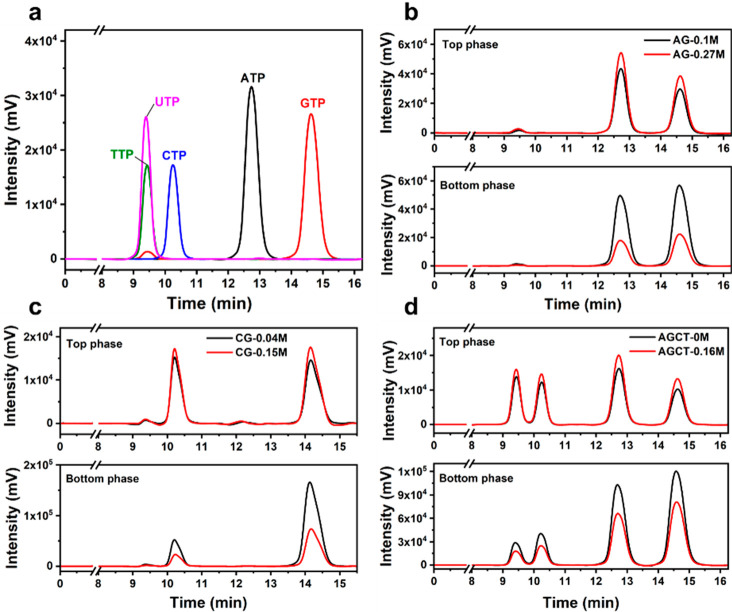
Figure 6.
HPLC analysis of (a) the pure NTPs and (b)–(d) the top phase and bottom phase of different coacervates combinations with two different salt concentration after centrifugation, respectively. Note: chromatograms in (a), (b), and (d) were recorded on X3, while chromatograms in (b) and Figure S13b were recorded on X2.

