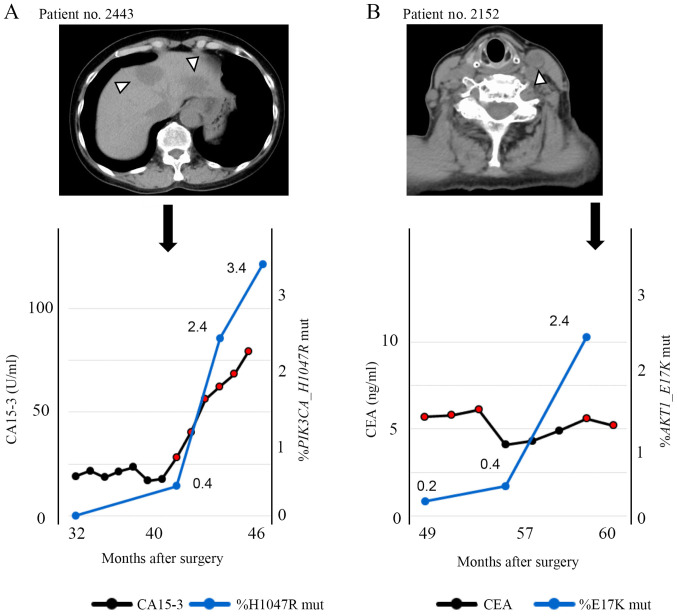
Figure 5.
Clinical course of case reports. (A) A 58-year-old woman with a diagnosis of TNBC. The graph shows the change in the percentage of PIK3CA H1047R mutations detected in cfDNA using ddPCR and the CA15-3 levels during the clinical course after surgery. CT shows multiple liver metastases 13 months after surgery and also the progression of liver metastases 25 months after surgery. CT shows further progression of the liver metastases 41 months after surgery. Arrowhead indicates liver metastasis. (B) A 77-year-old woman with Stage IIIB TNBC with direct extension to the skin and lymph node metastasis. The graph shows the change in the percent E17K mutation detected in cfDNA using ddPCR and the CEA levels during the clinical course after surgery. CT shows lymph node progression 11 months after surgery and 48 months after surgery. CT shows new left cervical lymph node metastasis. Arrowhead indicates lymph node metastasis. cfDNA, cell-free DNA; ddPCR, droplet digital polymerase chain reaction; CT, computed tomography; CA15-3, carbohydrate antigen 15-3; CEA, carcinoembryonic antigen.

