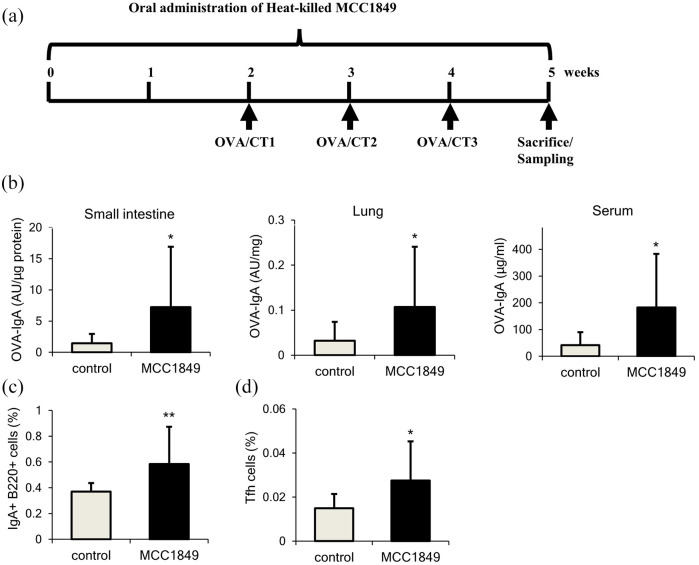
Figure 3.
(a) Fowchart of the animal experiment. (b) Antigen-specific IgA amount in small intestine, lungs, and serum after MCC1849 ingestion. (c) Proportion of IgA + B cells. (d) Tfh cells in Peyer’s patch after MCC1849 ingestion.28 *P < 0.05, **P < 0.01 versus control group by Student’s t-test.

