
Fig. 2.
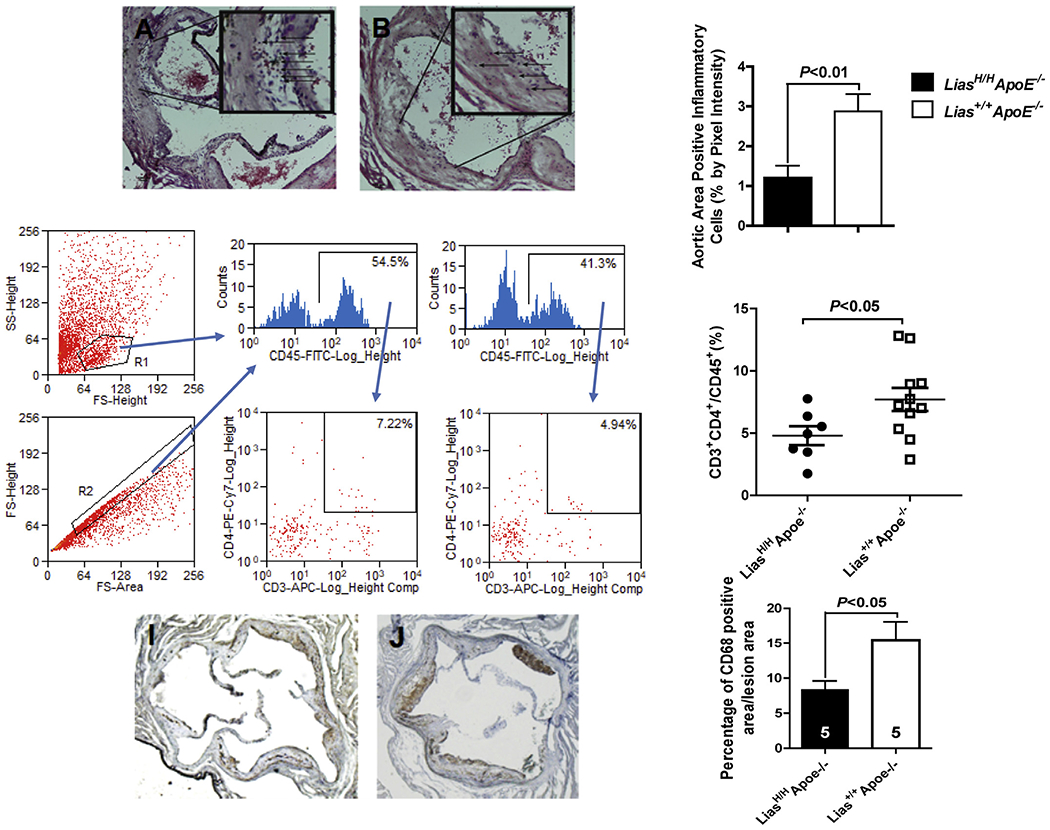
Histological analysis of the ascending aortic root. (A). Representative Lias+/+Apoe−/− aortic root (arrows in insert delineate to identified mononuclear cell nuclei). (B). Representative LiasH/HApoe−/− aortic root (arrows in insert delineate to identified the nuclei). (C). Student’s t-test was used to determine differences in aortic root cellular nuclei in LiasH/HApoe−/− compared to controls. Original magnification 40×.