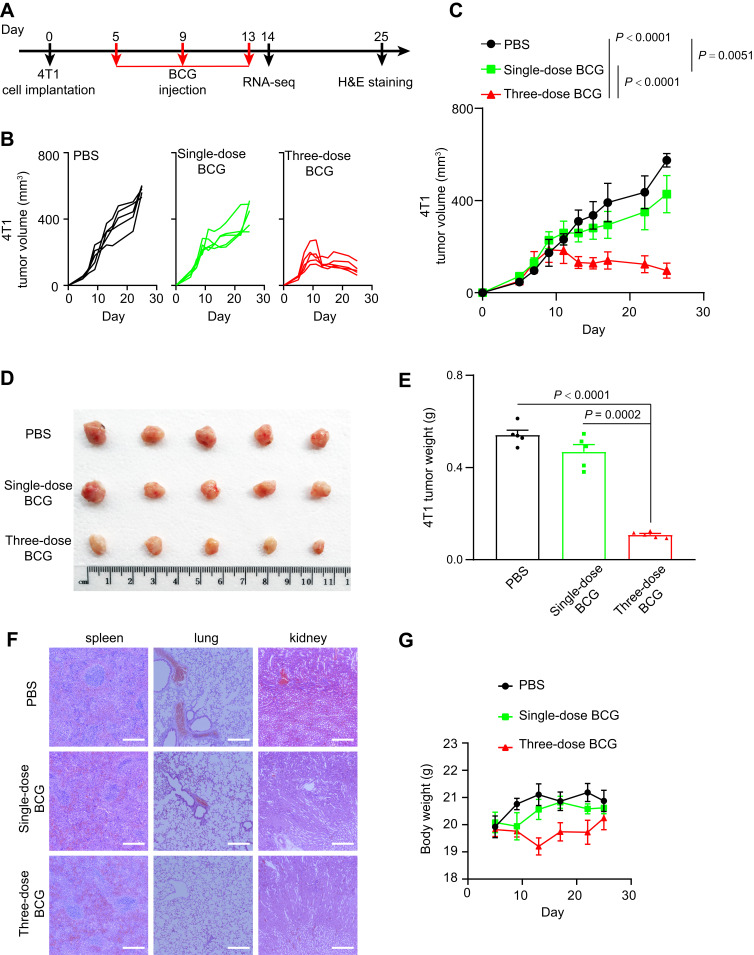
Figure 1.
BCG treatment inhibits the growth of TNBC.
Notes: (A) Schematic of BCG treatment on TNBC mouse model. (B) Tumor volume of an individual mouse. n = 5 mice per group. (C) Average tumor volume of mice as indicated. Mean ± s.d., two-tailed unpaired Student’s t-test. (D) Photographs of the tumors 20 d post treatment with PBS, single-dose BCG and three-dose BCG, respectively. (E) Average tumor weight of mice as indicated. Mean ± s.e.m., two-tailed unpaired Student’s t-test. (F) H&E-stained spleen, lung and kidney tissues of TNBC mouse model treated as indicated. Representative images of each group (n = 3 mice) are presented. Scale bar, 200 μm. (G) Weight monitoring results of mice with different treatments as indicated.

