Figure 3.
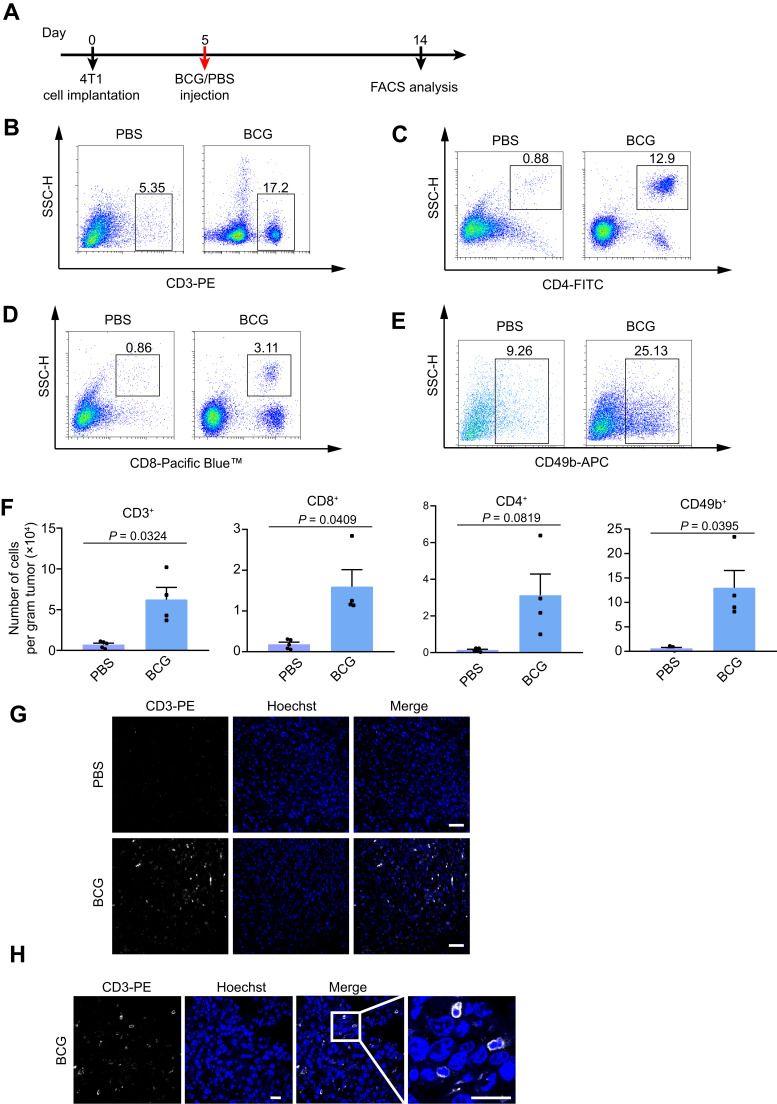
BCG treatment recruits infiltrating lymphocytes in the TME of TNBC mouse model.
Notes: (A) Schematic of BCG treatment on TNBC mouse model. n = 5 mice for PBS, 4 mice for BCG. (B–E) Representative flow cytometry plots for 4T1 tumor-infiltrating CD3+ (B), CD4+ (C), CD8+ (D), NK (E) cells analysis. (F) Quantification of the tumor-infiltrating lymphocytes from TNBC mouse model. n = 5 mice for PBS, 4 mice for BCG. Mean ± s.e.m., two-tailed unpaired Welch’s t-test. (G and H) Fluorescence images of CD3-PE-stained 4T1 tumor cells treated with BCG and PBS. Representative images of each group (n = 3 mice) are presented. Scale bar, 20 μm.
Abbreviation: BCG, Bacillus Calmette–Guérin.

