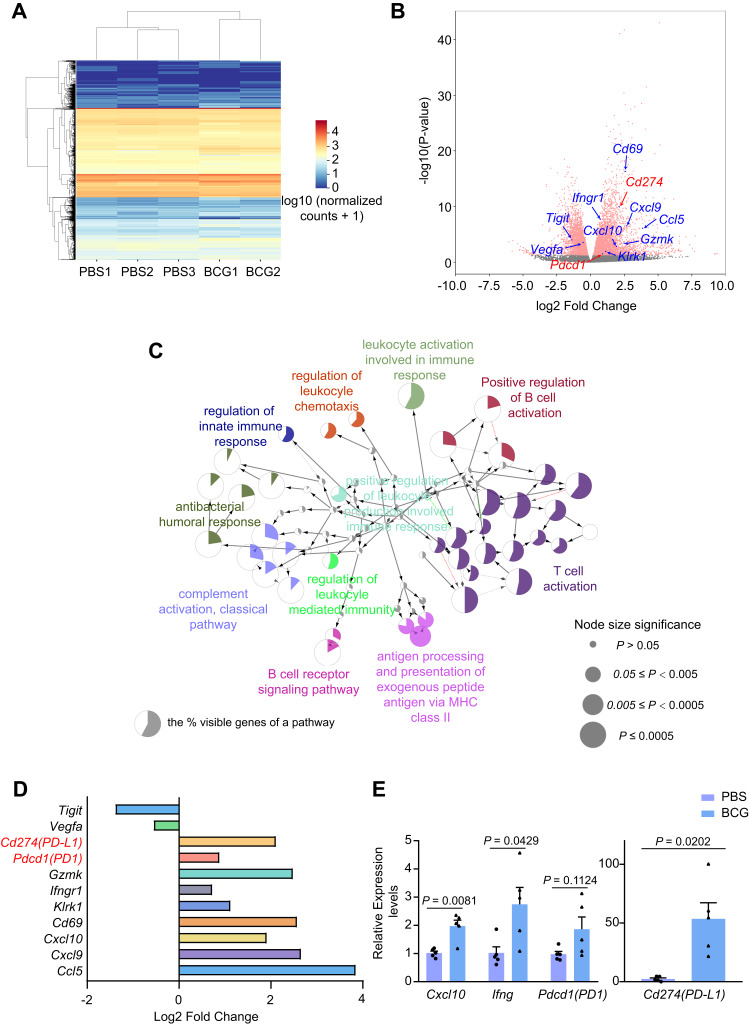
Figure 4.
RNA-seq analysis of TNBC treated with BCG or PBS.
Notes: (A) Cluster analysis heat map of differentially expressed genes in mice treated with PBS or BCG. (B) Volcano plot of the DEGs. (C) The immune system process pathways network of GO enriched DEGs from RNA-seq of tumors in the BCG group and PBS group. p ≤ 0.05, Kappa Score = 0.4. (D) The log2(fold change) of the DEGs. (E) Quantification of the relative expression levels of the DEGs. n = 5 mice per group. Mean ± s.e.m., two-tailed unpaired Welch’s t-test.
Abbreviations: DEGs, differential genes; GO, Gene Ontology.

