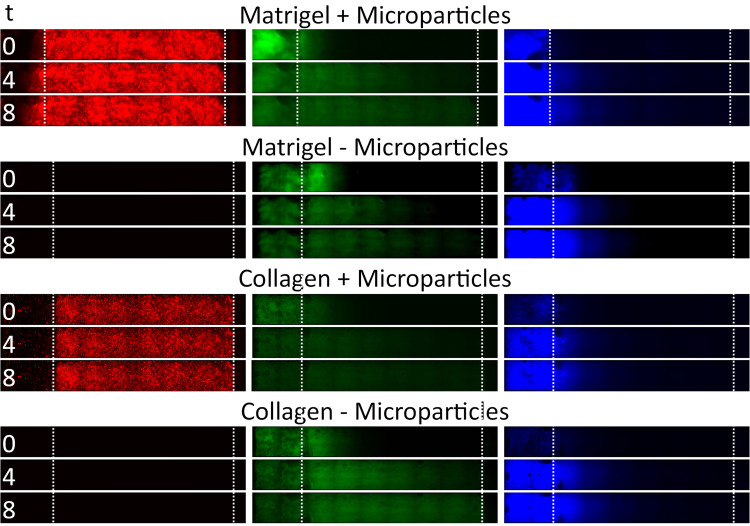
Figure 4.
Time series data from example channels, showing tissue penetration of fluorescein dye and 20 nm particles in different tissue scaffold conditions (gel type vs presence of microparticles). Images represent penetration at time = 0 h, 4 h and 8 h. Boundaries of tissue scaffold location and channel end is denoted between dotted white lines.

