
Fig. 6.
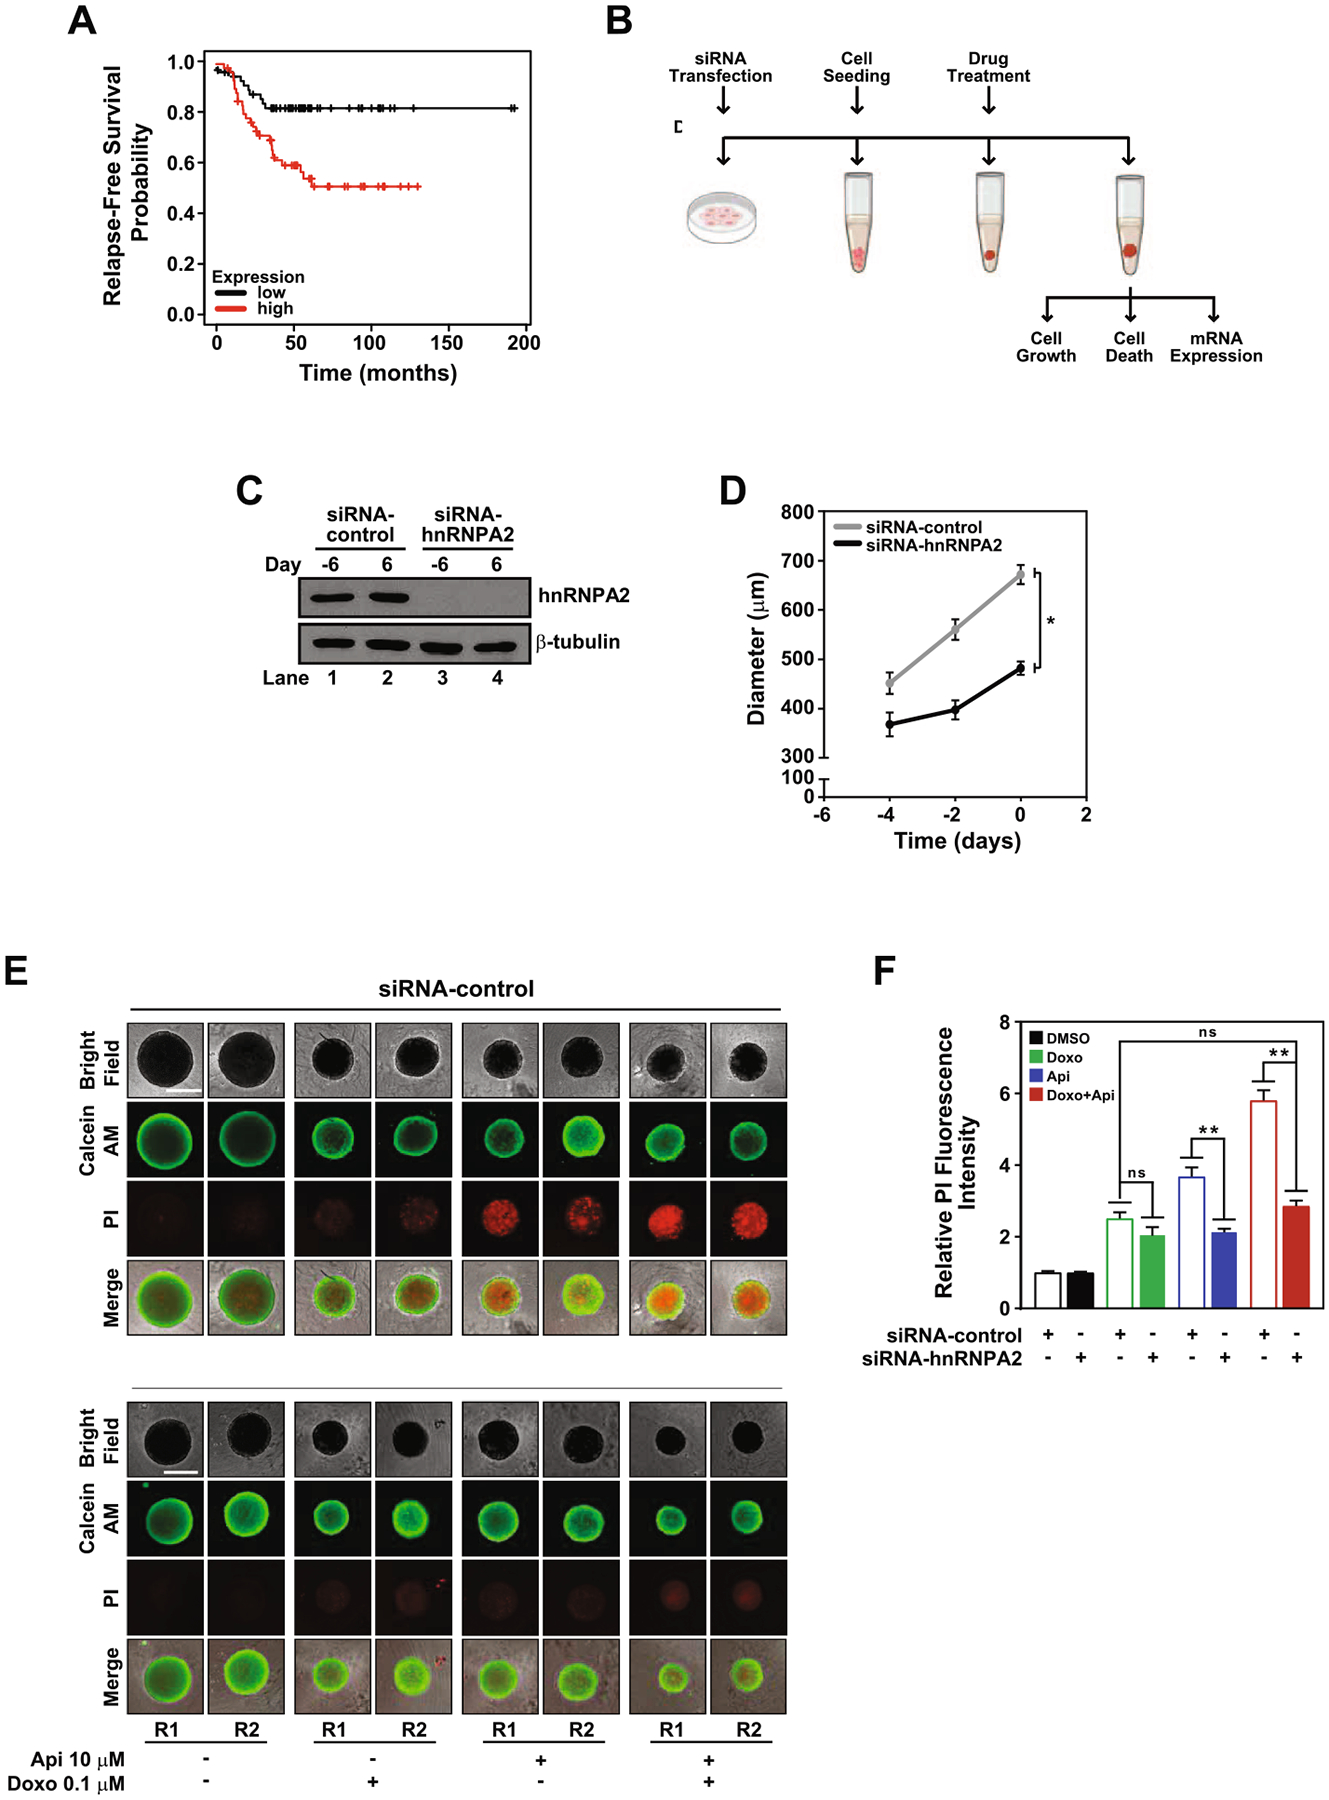
HnRNPA2 regulates apigenin-mediated sensitization of TNBC spheroids to doxorubicin-induced apoptosis. (A) Kaplan-Meier survival curve was analyzed for hnRNPA2 expression and the probability of Relapse-Free Survival in TNBC patients (log-rank p = 0.0033). (B) Schematic representation of experiments involving silencing of hnRNPA2, spheroid formation and treatments. MDA-MB-231 cells cultured in 2D were transfected with siRNA-control or siRNA-hnRNPA2 and used to form spheroids (day −6 to day 0). (C) hnRNPA2 protein expression was evaluated by western blotting of protein lysates of siRNA-control or siRNA-hnRNPA2 silenced cells (lanes 1 and 3) collected at day −6 and spheroids (lanes 2 and 4) at day 6, equal amounts of protein lysates loaded and membranes immunoblotted with anti-hnRNPA2 antibodies. The same membranes were re-blotted with anti-β-tubulin antibodies. (D) Growth curve of siRNA-control or siRNA-hnRNPA2 silenced spheroids. (E) Cell death evaluated by calcein AM (green) and PI (red) staining in siRNA-hnRNPA2 and siRNA-control spheroids treated with DMSO, 0.1 μM doxorubicin, 10 μM apigenin or simultaneously with doxorubicin and apigenin in combination for 6 days. Two representative spheroids, depicted as R1 and R2, shown for each treatment. Scale bar: 500 μm. (F) Relative fluorescence intensity of PI staining from samples shown in (D). Data represent mean ± SEM, N = 3; each biological repeat (N) comprised of 3–4 spheroids. *p < 0.015, **p < 0.001, compared to siRNA-control subjected to similar treatment, ns indicates no statistical difference among indicated treatments.