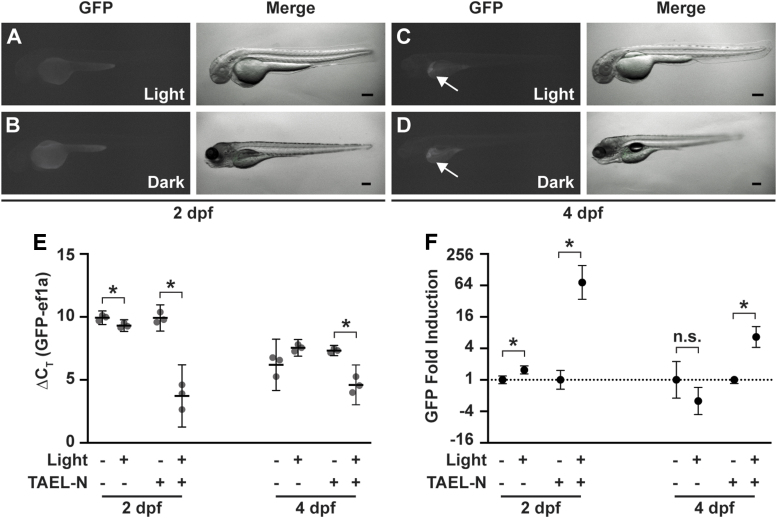
FIG. 6.
Basal expression from Tg(C120F:GFP) is not responsive to light. (A–D) Representative images of Tg(C120:GFP) embryos at 2 dpf (A, B) or larvae at 4 dpf (C, D). Embryos were illuminated for 12 h with blue light pulsed at a frequency of 1 h on/1 h off (A, C) or kept in the dark (B, D). Images were acquired between 18 and 20 h after exposure to the pulsed light regime. Arrows in (C, D) point to ectopic liver expression of GFP. Scale bars, 200 nm. (E) qPCR analysis of GFP expression from Tg(C120:GFP) or Tg(C120F:GFP);Tg(ubb:TAEL-N) zebrafish at 2 or 4 dpf illuminated with constant blue light for 1 h or kept in the dark. Data are presented as ΔCT values normalized to the housekeeping gene ef1a. Dots represent biological replicates. Solid lines represent mean. Error bars represent SD. *p < 0.05. (F) Fold induction of GFP expression in response to light calculated from the same qPCR analysis shown in (E). Y-axis is set at log2 scale. Dotted line, y = 1. Data are presented as mean ± SD. *p < 0.05. dpf, days postfertilization; n.s., not significant.

