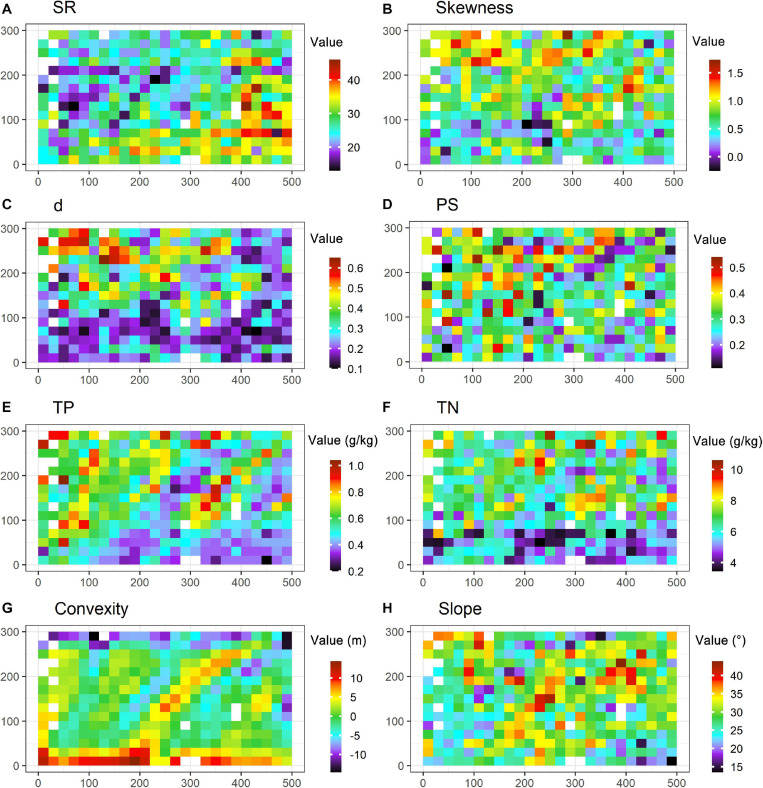
FIGURE 2.
Species diversity and environmental conditions in the 15-ha plot. Subgraphs are the maps of SR (species richness, A), skewness (B), d (the Berger-Parker index, C), PS (proportion of singletons, D), TP (soil total phosphorus, E), TN (soil total nitrogen, F), convexity (G) and slope (H) at the 15-ha plot with the resolution at 20 m × 20 m. Blanks refer to the subplots with outliers that are filtered out in analyses.

