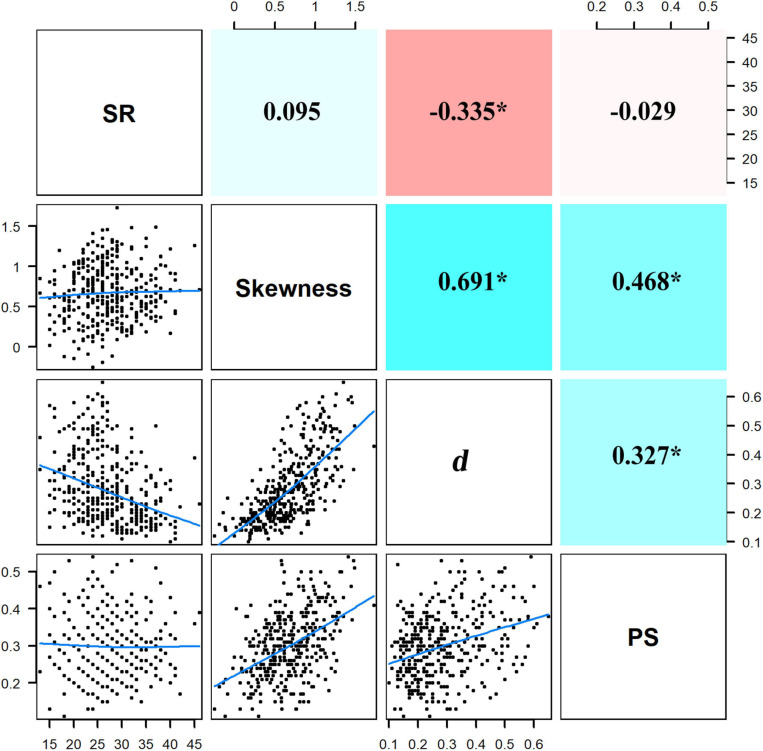
FIGURE 4.
Pairwise relationships among species richness (SR), skewness, Berger–Parker index (d), and proportion of singletons (PS). Blue lines in the bottom left panels are the smooth curves about the pairwise relationships. Values in the upper right panels are the coefficients of correlation with significant values asterisked (p < 0.05); positive and negative coefficients have their background panels colored with cyan and red, respectively, larger absolute values of coefficients are in darker colors.

