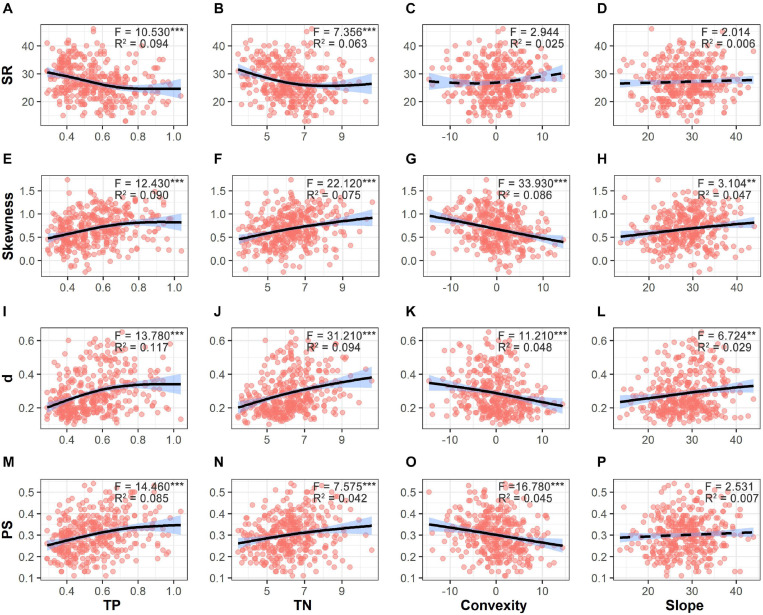
FIGURE 5.
Variations in species richness (SR, A–D), skewness (E–H), d (the Berger–Parker index, I–L), and PS (proportion of singletons, M–P) along the gradients of soil total phosphorus (TP), soil total nitrogen (TN), convexity and slope. Fitted lines are shown in black with 95% interval colored in blue. Solid lines refer to significant relationships (p < 0.05), while dashed lines refer to non-significant relationships. Significant level: ***p < 0.001; **p < 0.01.

