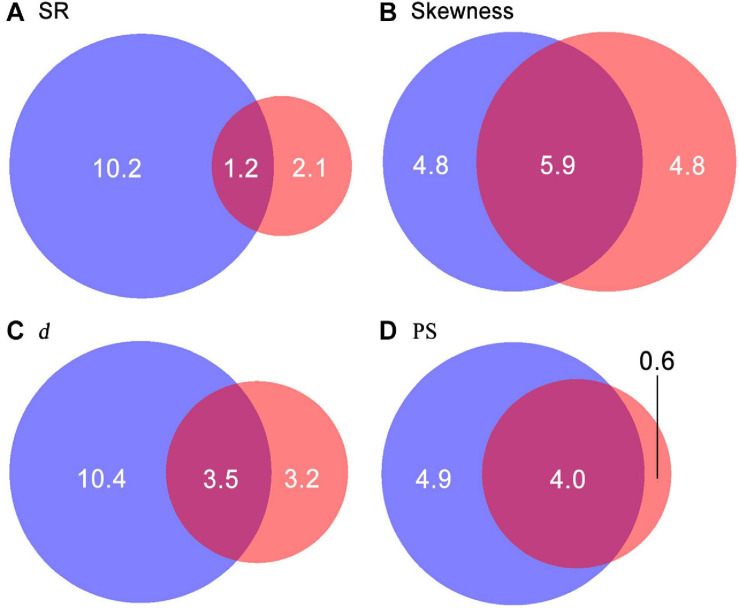
FIGURE 6.
Variation partitioning for SR (species richness, A), skewness (B), d (the Berger–Parker index, C), and PS (proportion of singletons, D). Sums of values within the blue and red circles are the percentage of variations in diversity patterns explained by soil nutrients and topographical factors, respectively. Values in the overlapping areas between the two circles are the proportions of variations jointly explained by soil nutrients and topographical factors.

