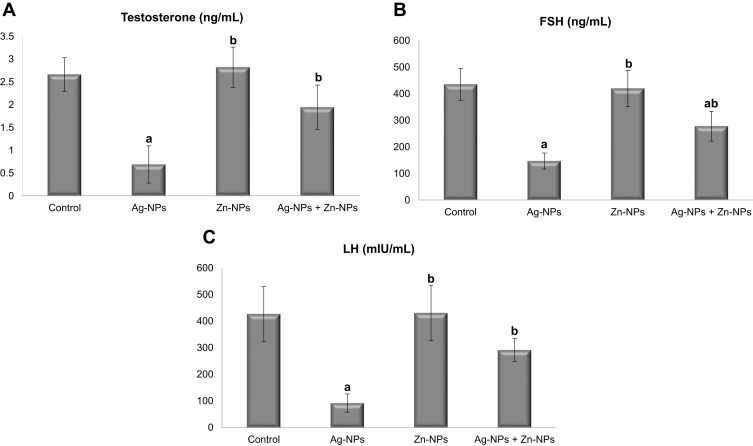
Figure 6.
Effects of exposure to Ag-NPs and/or Zn-NPs on (A) testosterone, (B) FSH, and (C) LH levels in serum. Values are presented as mean ± SD (n = 10 rats/group). (a) indicates presence of a statistically significant difference from the control group and (b) indicates presence of a statistically significant difference from Ag-NPs group at p< 0.05.

