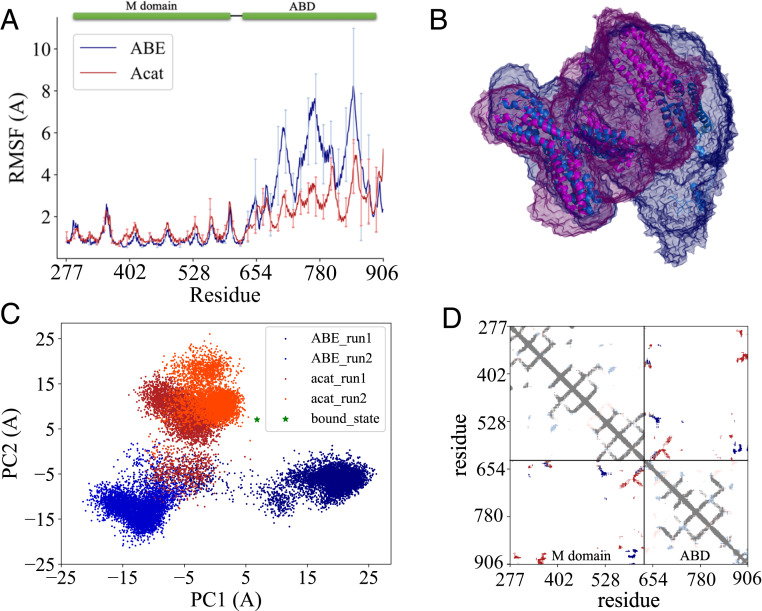
Fig. 4.
MD simulation analyses of ABE and α-catenin dimer. (A) Comparison of RMSFs of M domain and ABD for ABE and α-catenin dimer during the simulations (from 150 to 250 ns). Error bars are SDs over different trajectories. (B) Space visited by M domain and ABD during the 250-ns simulations. ABE is in marine, and α-catenin dimer is in magenta. (C) Conformational landscape of ABD projected along the first two PC modes sampled in the simulations. Green star denotes the position of the actin filament-bound conformation. (D) Contact map of M domain and ABD. Dark blue indicates contacts shared by both ABE and α-catenin dimer. Red contacts exist only in ABE while light blue shows contacts only in α-catenin dimer.

