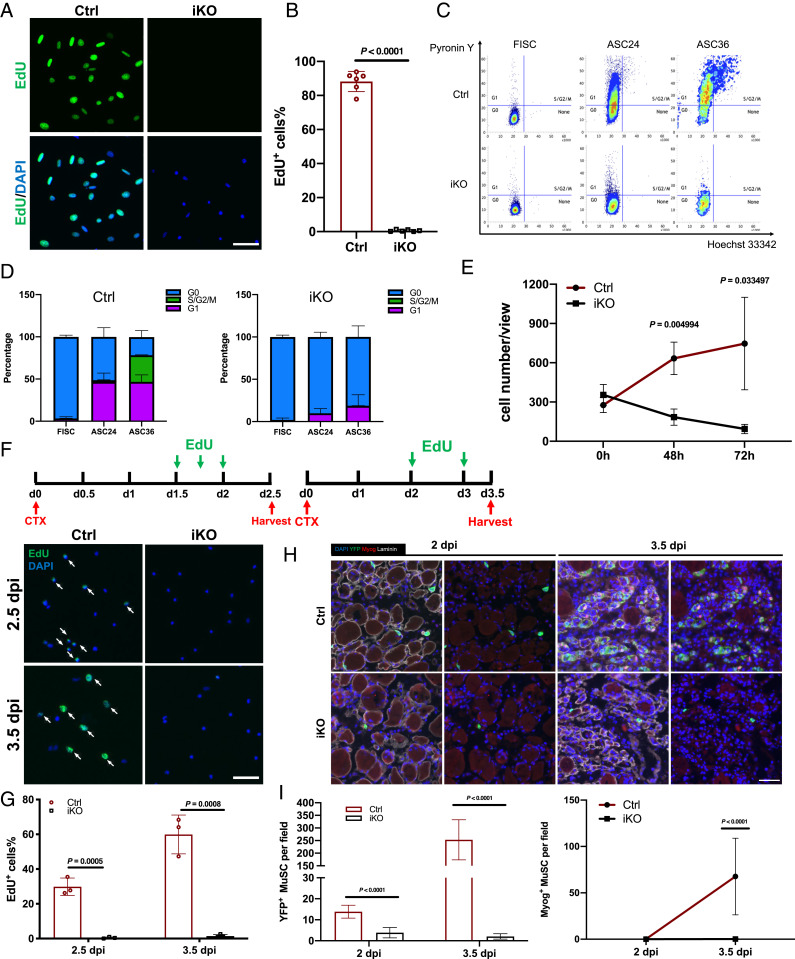
Fig. 2.
Paxbp1 critically controlled cell-cycle reentry of quiescent MuSCs. (A) FISCs from Ctrl and Paxbp1-iKO mice were cultured for 48 h in the presence of EdU (10 µM) before fixation followed by staining for EdU. (B) Quantification of the percentage of EdU+ SCs over total sorted SCs (n = 6 mice per group). (C) FISCs from Ctrl and iKO mice with or without additional culturing were subjected to cell-cycle analysis using Pyronin Y and Hoechst 33342 double staining. Representative flow cytometry plots are shown. (D) Quantification of the data in C (n = 3 mice per group). (E) Similar numbers of FISCs from Ctrl and iKO mice were cultured for up to 3 d and growth curves were plotted (n = 3 mice per group). (F, Top) Experimental schematics. (F, Bottom) YFP+ SCs were sorted by FACS and immediately stained for EdU. White arrows indicate EdU+ MuSCs. (G) Quantification of the percentage of EdU+ SCs over total YFP+ SCs in F (n = 3 mice per group for each time point). (H) TA muscle sections from Ctrl and iKO mice that were injured for 2 and 3.5 d were subjected to immunostaining for YFP, Myog, and laminin. (I) Enumeration of YFP+ and Myog+ cells per field of view in H (cells in five different fields of view from each mouse were counted; n = 3 mice per group). Nuclei were counterstained with DAPI. Data are presented as mean ± SD. (Scale bars, 50 µm.)

