Fig. 2.
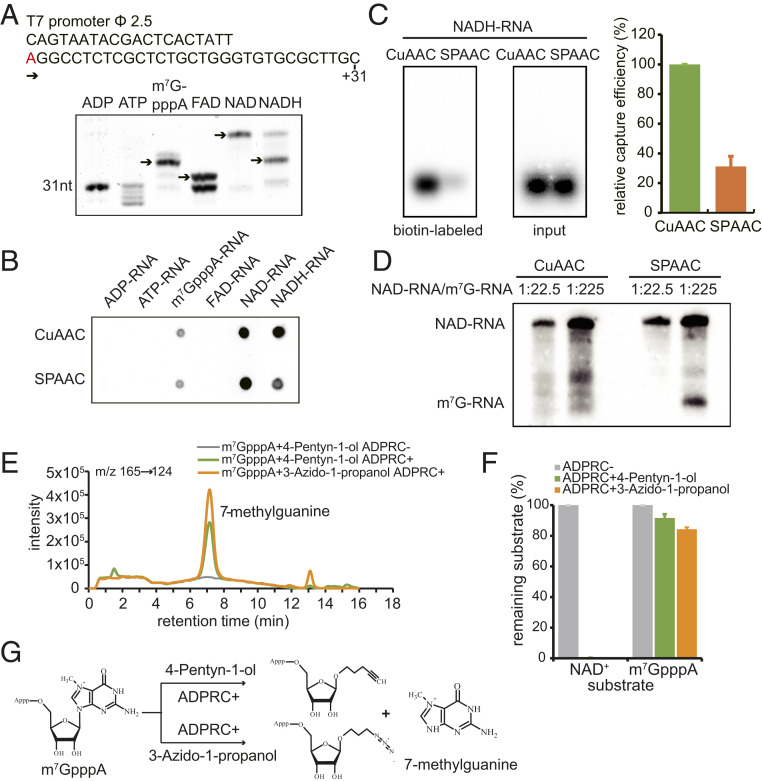
The specificity of CuAAC- and SPAAC-NAD reactions. (A) In vitro transcription with ADP, ATP, m7GpppA, FAD, NAD+, or NADH as the initiating nucleotide. (Top) Sequence of the DNA template with the T7 promoter. The “A” in red is the transcription start site. (Bottom) Boronate affinity electrophoresis of each in vitro-transcribed RNA with different 5′ end caps. The arrows indicate the properly capped species. (B) A dot blot assay to detect biotinylated RNAs after the in vitro-transcribed, 5′-end capped RNAs in A underwent CuAAC- or SPAAC-NAD reactions. The same amount of RNA was directly dotted onto a nylon N+ membrane and probed with streptavidin–horseradish peroxidase, and biotin signals were detected with the chemiluminescent nucleic acid detection module kit. (C) A gel blot assay of an in vitro-transcribed NADH-RNA after CuAAC- or SPAAC-NAD reactions. Biotin signals were detected as in B, and input RNA was detected with a radioactive probe. The intensities of bands in the gels were measured using ImageJ. The bar plot on the Right shows the relative capture efficiency of SPAAC- and CuAAC-NAD reactions as defined by the ratio between biotin signal intensity and input RNA level (with the CuAAC efficiency set as 1). Error bars represent SE from three independent replicates. (D) Comparison of reactivity between an NAD-RNA and an m7GpppA-RNA in CuAAC- or SPAAC-NAD reactions. The reactions were performed on mixtures of in vitro-transcribed NAD- and m7GpppA-RNAs at molar ratios 1:22.5 and 1:225. The RNAs were then resolved in a 12% PAGE gel and transferred to a nylon N+ membrane. Biotin signals were detected as in B. The lengths of the NAD-RNA and the m7GpppA-RNA were 70 and 31 nt, respectively. (E) HPLC ion chromatogram and MS/MS transitions (m/z 165→124) of the 7-methylguanine produced in the ADPRC-catalyzed reaction between m7GpppA and 3-azido-1-propanol or 4-pentyn-1-ol. Reaction of m7GpppA and 4-pentyn-1-ol without ADPRC was used as a control. (F) Substrates (m7GpppA or NAD+) remaining after the reaction with 3-azido-1-propanol or 4-pentyn-1-ol catalyzed by ADPRC. The percentage was calculated by the peak area of m7GpppA or NAD+ after the ADPRC reaction relative to the peak area in the ADPRC− control. The error bars represent SE calculated from three independent experiments. (G) Schematic diagram showing the proposed products of ADPRC-catalyzed transglycosylation with m7GpppA and 3-azido-1-propanol or 4-pentyn-1-ol.

