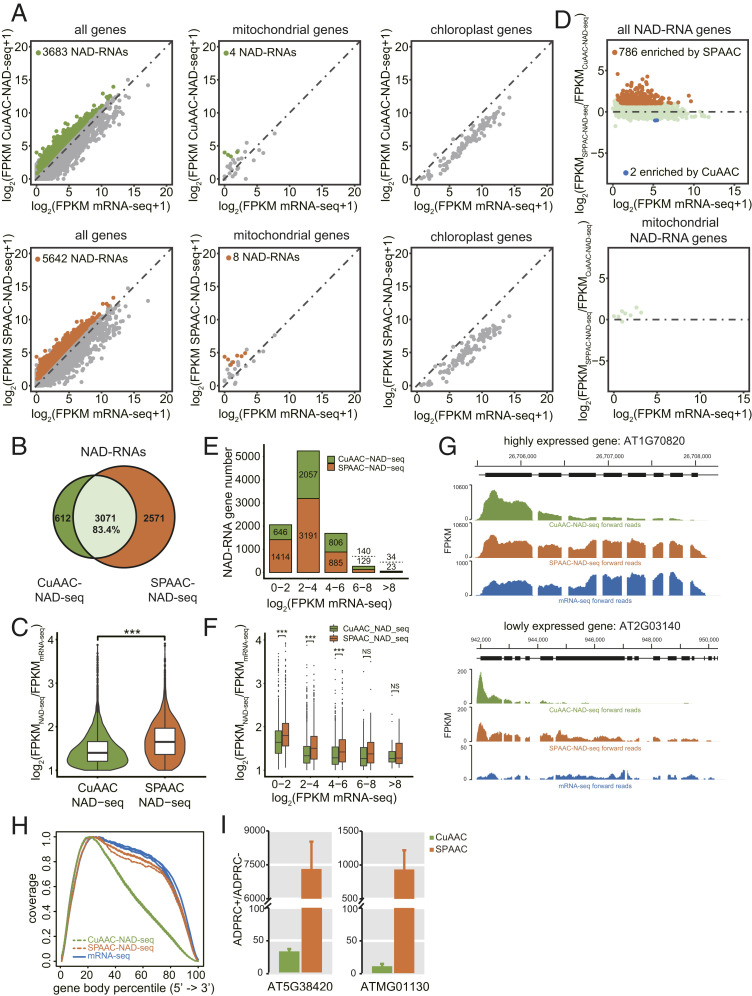
Fig. 5.
Profiling of NAD-RNAs by CuAAC and SPAAC-NAD-seq. (A) Scatter plots comparing log2 FPKM values between NAD-seq and mRNA-seq in m7G-depletion samples for all genes, mitochondrial genes, and chloroplast genes. The green and orange dots represent NAD-RNAs identified by CuAAC-NAD-seq and SPAAC-NAD-seq, respectively. (B) Scatter plots showing the relative levels of NAD-RNAs as determined by CuAAC-NAD-seq and SPAAC-NAD-seq. The log2 FPKM ratio between SPAAC-NAD-seq and CuAAC-NAD-seq for all identified NAD-RNAs was plotted against the log2 FPKM of mRNA-seq. The orange dots represent the NAD-RNAs enriched (fold change ≥ 2; adjusted P value < 0.05) in SPAAC-NAD-seq, and blue dots represent the NAD-RNAs enriched (fold change less than −2; adjusted P value < 0.05) in CuAAC-NAD-seq. (C) The overlap of NAD-RNAs identified by CuAAC-NAD-seq and SPAAC-NAD-seq in m7G-depletion samples. Numbers represent the numbers of NAD-RNAs. The percentage is derived from the number of overlapped NAD-RNAs divided by the total number of NAD-RNAs identified by CuAAC-NAD-seq. (D) Violin plots showing the levels (log2[FPKMNAD-seq/FPKMmRNA-seq]) of common NAD-RNAs identified by CuAAC-NAD-seq and SPAAC-NAD-seq in m7G-depletion samples. The center line in the “box” shows the median value. ***P value < 0.001 by two-tailed Student’s t test. (E) The numbers of NAD-RNA genes identified by CuAAC-NAD-seq or SPAAC-NAD-seq in m7G-depletion samples. Genes were separated into five groups based on their mRNA-seq abundance (log2 FPKM). Numbers above and below the dotted lines represent NAD-RNAs identified by CuAAC-NAD-seq and SPAAC-NAD-seq, respectively. (F) The levels (log2 [FPKMNAD-seq/FPKMmRNA-seq]) for all identified NAD-RNAs by CuAAC-NAD-seq or SPAAC-NAD-seq in m7G-depletion samples. Genes were separated into five groups based on their mRNA-seq abundance (log2 FPKM). The center line in the “box” shows the median value. NS denotes no significance; ***P < 0.001 by two-tailed Student’s t test. (G) Genome browser views of aligned reads from CuAAC-NAD-seq and SPAAC-NAD-seq in m7G-depletion samples and from mRNA-seq for two genes. Both genes were identified as NAD-RNAs by SPAAC-NAD-seq, but as non-NAD-RNAs by CuAAC-NAD-seq. The coding sequence is displayed as black bars. (H) Read distribution along gene bodies in CuAAC-NAD-seq, SPAAC-NAD-seq, and mRNA-seq in mock-depletion samples. Three lines of the same color represent biological replicates. (I) Quantification of transcript levels by qRT-PCR in ADPRC+ vs. ADPRC− samples after CuAAC or SPAAC-NAD reactions. The NAD-RNAs after both reactions were eluted from streptavidin beads, reverse transcribed by oligo(dT) primers, and then detected by PCR with gene-specific primers. Data are normalized to the ADPRC− control set as 1. Error bars represent SE. Three technical replicates from each of two biological replicates were performed.

