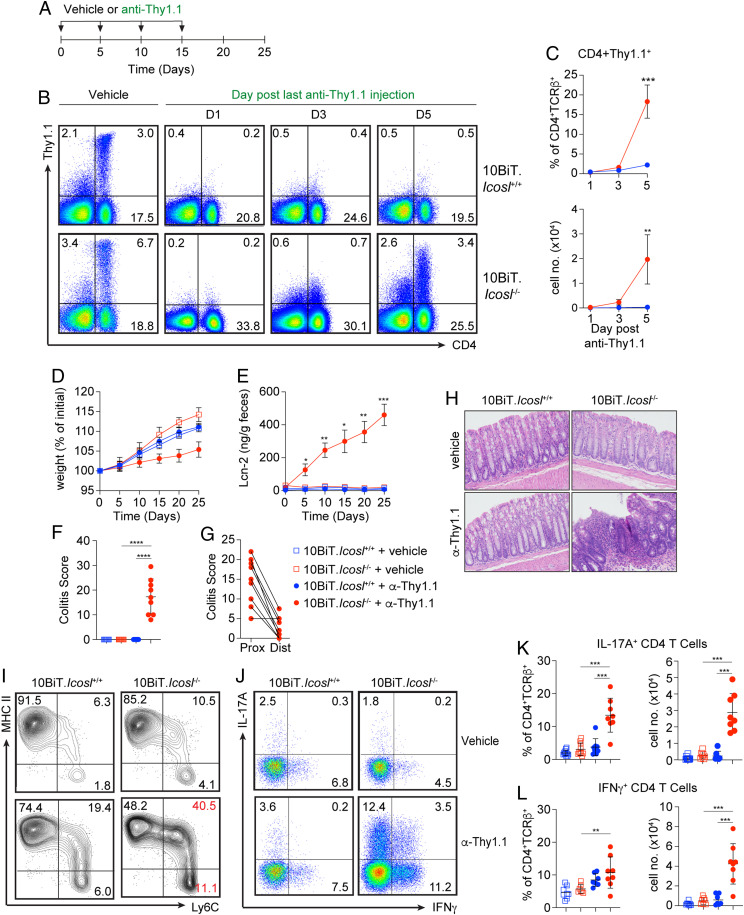
Fig. 1.
Transient depletion of IL-10–producing cells from ICOSL-deficient mice results in colonic inflammation. (A) Experimental design for Thy1.1+ cell depletion experiments. (B) Representative flow cytometry plots demonstrating the impact of anti-Thy1.1 treatment on Thy1.1 expression on colon lamina propria cells of 10BiT.Icosl+/+ or 10BiT.Icosl−/− mice 1, 3, or 5 d after anti-Thy1.1 injection. (C) Graphs displaying frequencies (Upper) and numbers (Lower) of CD4+TCR-β+Thy1.1+ cells from mice analyzed as in B; n = 9 mice/group. (D) Percent change in weight and (E) fecal Lcn-2 levels measured every 5 d from start of anti-Thy1.1 injection. (F) Total histopathological scores of colonic tissue sections from all mice at day 25. (G) Histopathological scores of proximal (Prox) and distal (Dist) colon sections. (H) Representative hematoxylin and eosin–stained photomicrographs depicting the colonic inflammation observed in mice examined as in F and G. n = 8 to 10 mice/group. (I) Representative flow cytometry plots demonstrating colonic “monocyte waterfall” cell subsets from WT and Icosl−/− mice at 5 d after vehicle or anti-Thy1.1 injection. (J) Representative flow cytometry plots showing IFNγ and IL-17A expression by CD4 T cells in the colon lamina propria of mice analyzed in D–H. Scatter plots show frequencies (Left) and numbers (Right) of IL-17A+ (K) and IFNγ+ (L) CD4 T cells from mice analyzed as in A. n = 7 to 9 mice/group. Error bars represent mean ± SD; P values were calculated by ANOVA for repeated measures with Bonferroni correction (B–E) or by ANOVA followed by Tukey’s multiple comparisons test (F, G, K, L). *P < 0.05, **P < 0.01, ***P < 0.001, ****P < 0.0001. All data are compiled from two (B, C, I, K, L) or three (E–G) independent experiments.

