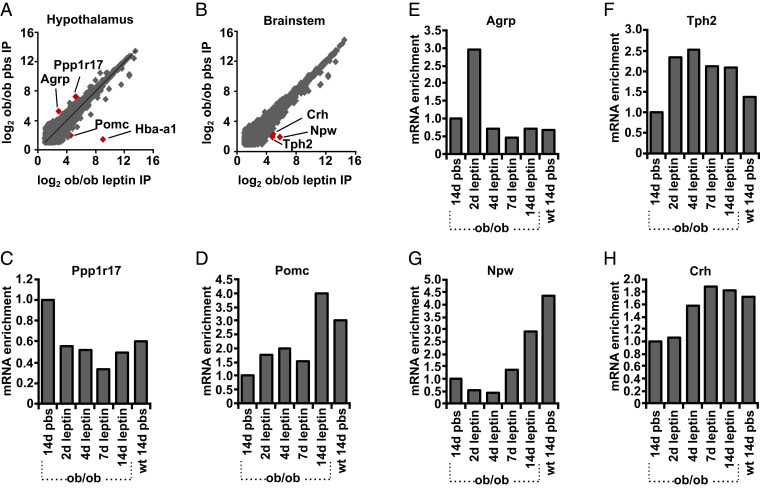
Fig. 1.
Differential enrichment of genes after leptin treatment. PhosphoTRAP was performed on the samples indicated below, and the RNA abundance determined by the number of RNA-seq reads was plotted in pair-wise comparisons showing (A) differential enrichment of genes in pS6 immunoprecipitates determined by RNA-seq in 14 d leptin treatment of ob/ob mice vs. PBS in (A) hypothalamus and (B) brainstem. TaqMan assays were then performed for the pS6-precipitated polysomes after 14 d PBS treatment of ob/ob mice after leptin treatment (for 2, 4, 7, and 14 d) of ob mice and after 14 d PBS treatment of WT mice. The genes shown are those whose level of enrichment had changed in the comparison between 14 d of leptin vs. PBS (specific genes are shown in A and B): (C) Ppp1r17, (D) POMC, (E) AGRP, (F) Tph2, (G) Npw, and (H) CRH. Data are expressed as the ratio of fold enrichment (IP per input) for each group of mice divided by the fold enrichment (IP per input) for ob/ob mice treated with PBS for 14 d. Homogenates of pooled hypothalami from 15 to 20 mice are used for each group.

