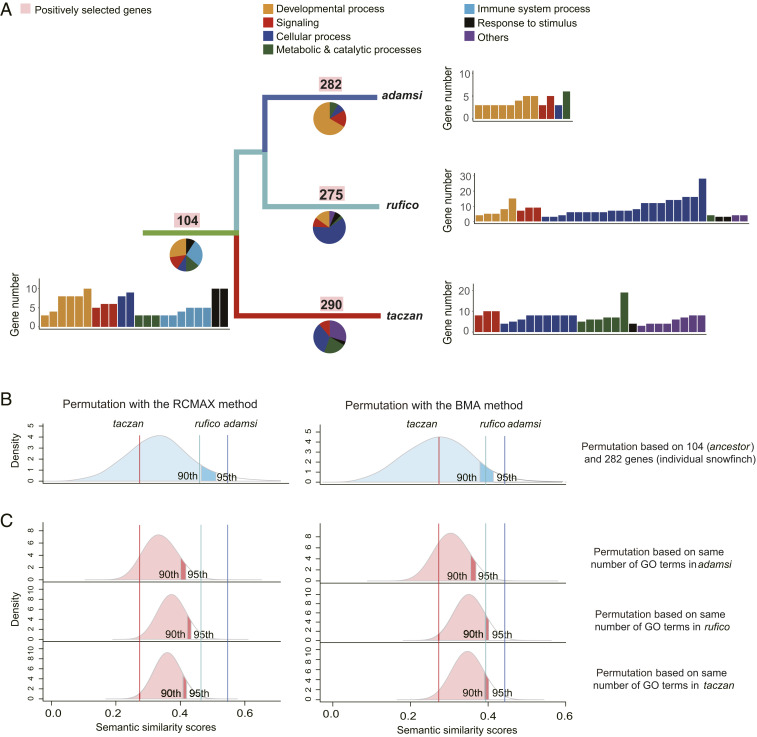
Fig. 4.
Functional enrichment analyses of PSGs. (A) Distribution of overrepresented GO terms is shown as a pie chart below the branch. Numbers of PSGs applicable for enrichment analyses are shown above branches. Note that the number is smaller than the counterpart in Fig. 2A because some genes do not have a human ortholog and thus could not be included in the analyses. GO terms are grouped into seven major categories including developmental process (yellow), signaling (red), cellular process (dark blue), metabolic and catalytic processes (green), immune system process (light blue), response to stimulus (black), and others (purple). (B and C) The observed SS scores and permutated ones between ancestor and the descendant snowfinches based on genes (B) and GO terms (C). Two algorithms of summarization including RCMAX (Left) and BMA (Right) are used. Dark blue, light blue, and red vertical lines show the observed pairwise SS values between ancestor and each of the snowfinches (adamsi, rufico, and taczan, respectively). Blue (permutations based on same number of genes) and red (permutations based on same number of GO terms) shades show 10,000 permutated SS values with 95th and 90th percentiles labeled.

