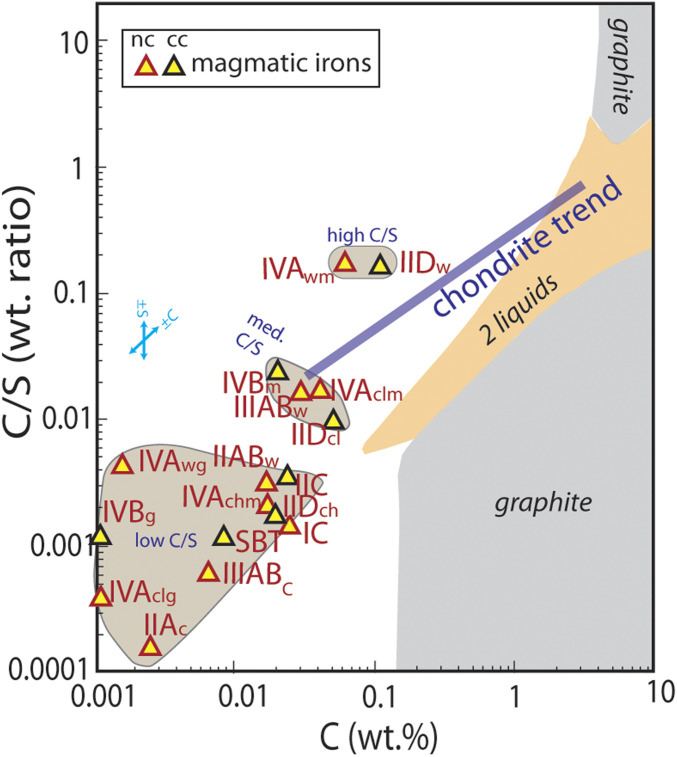
Fig. 3.
C/S versus C compositions of planetesimal cores calculated for magmatic iron meteorite groups (SI Appendix, Table S2 and Fig. 2). Subscripts (key in SI Appendix, Table S2) are as described in caption to Fig. 2. The diagonal line shows the trend of chondritic compositions, from Fig. 1. Fields of immiscible liquids and graphite saturation in the system Fe–C–S are shown for the 100-kPa liquidus surface from the thermodynamic model of Tafwidli and Kang (83). The small blue arrows illustrate the effect of independent variation of C or S concentrations on the C/S versus C plot.

