Fig. 2.
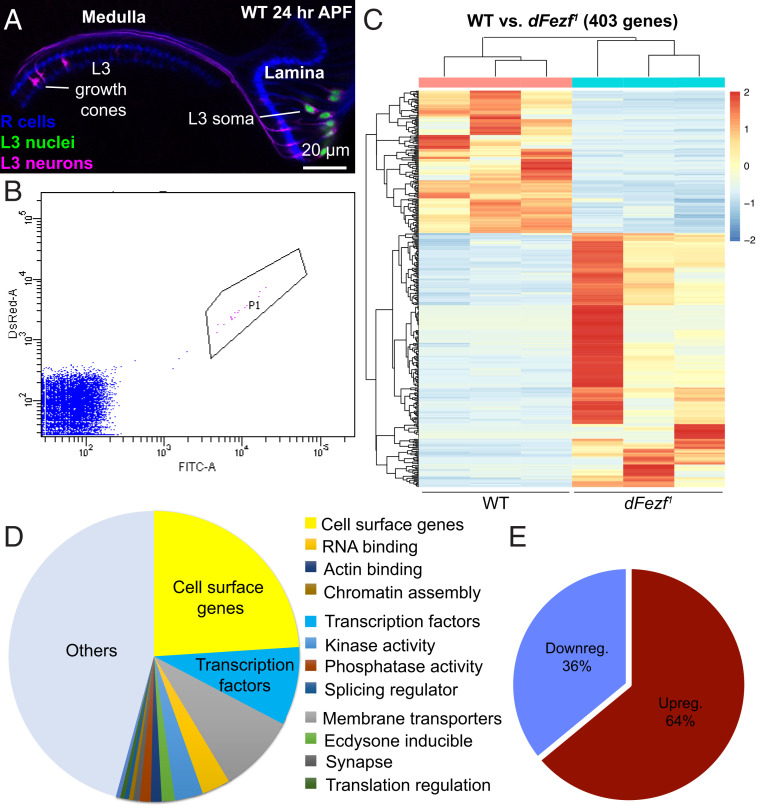
RNA-seq identified 403 differentially expressed genes in dFezf1 mutant L3 neurons. We generated WT and dFezf1 transcriptomes of FACS-sorted L3 MARCM clones at 24 h APF. (A) Confocal image illustrating WT optic lobe at 24 h APF (at this stage, the lamina is located laterally to the medulla). L3 MARCM clones are pictured. L3 neuron somas and cell membranes are labeled with GFP (green) and tdTOM (magenta), respectively. R1 to R8 photoreceptors are also pictured in blue (mAB24B10). The sample was taken from the same crosses used to generate transcriptomes. (B) FACS plot illustrating selected cluster of GFP/tdTOM double-positive cells. These are L3 MARCM clones shown in A; 100,000 events are shown. (C) Heatmap illustrating up-regulated and down-regulated genes. Each column represents a different biological replicate of the genetic background indicated below. Each row represents the normalized expression of a differentially expressed gene. (D) Pie chart illustrating a representation of different gene types based on previously curated databases (11, 46). Cell surface genes and transcription factors are the two largest groups. (E) Pie chart illustrating the ratio of up- and down-regulated genes. The majority of differentially expressed genes are up-regulated.

