
Extended Data Figure 4. AAV delivery of SaCas9 and Sajw33 unsilences paternal Ube3a at P30 with no detectable AAV mediated toxicity.
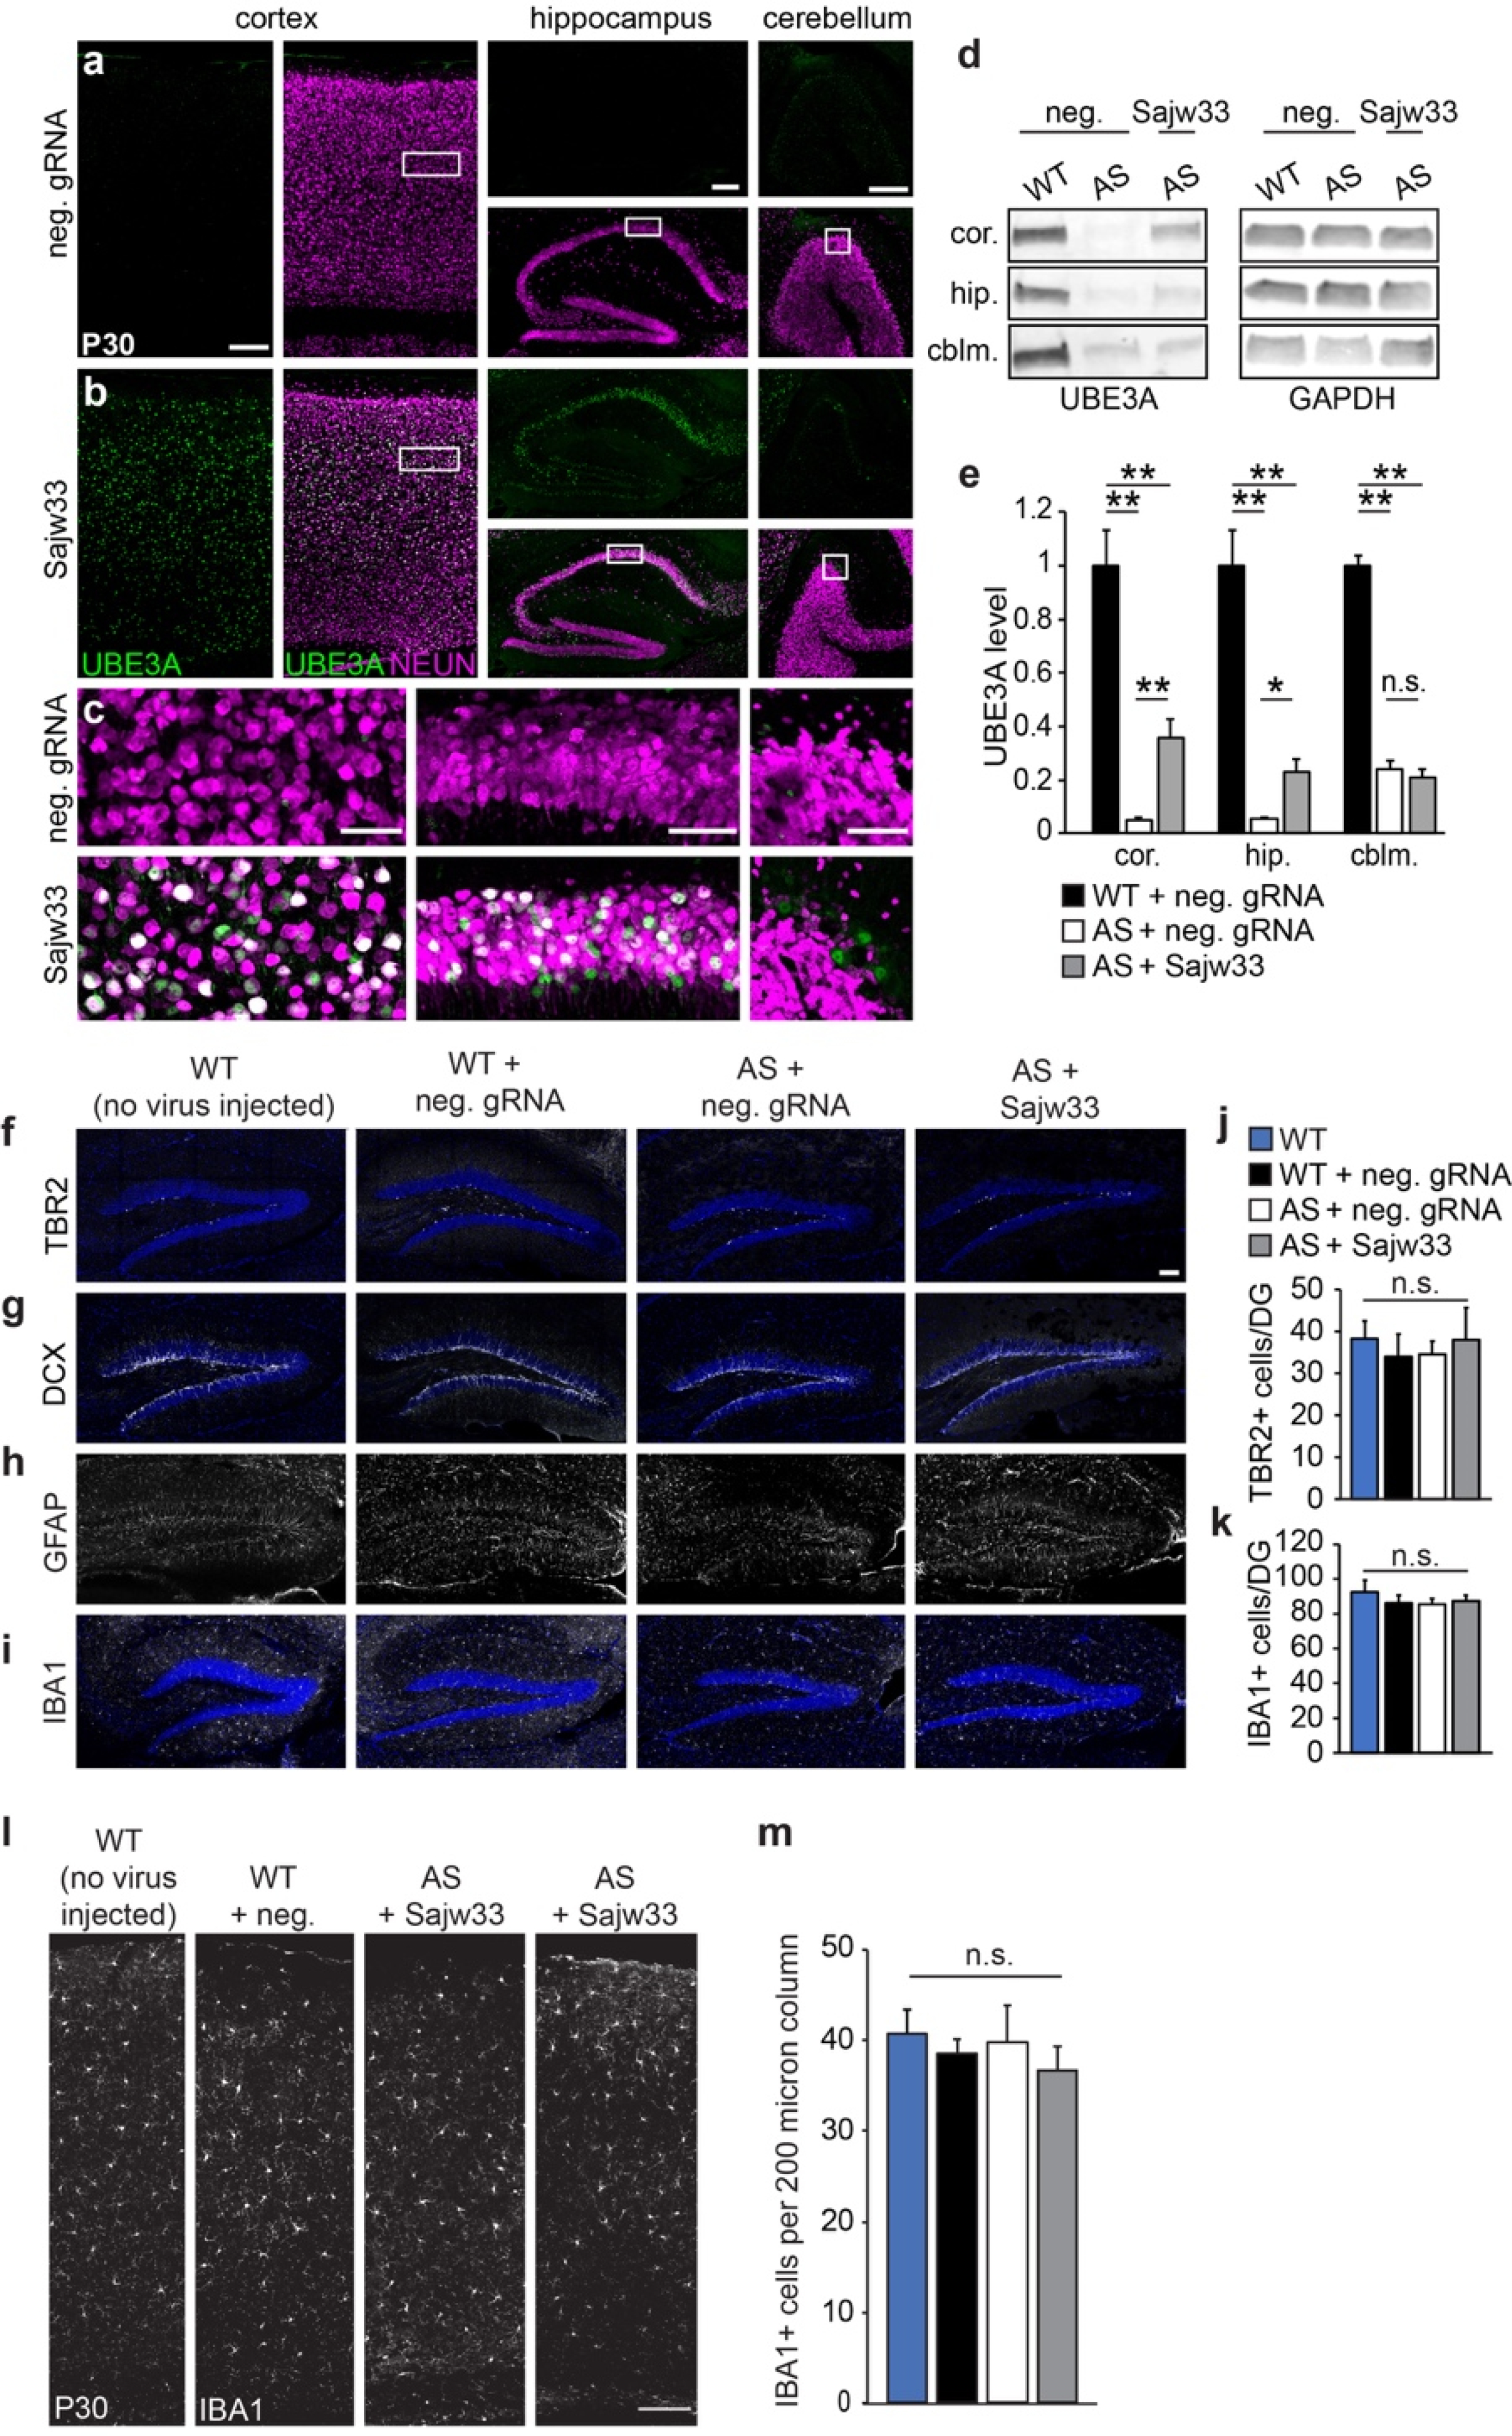
a-c. Histological staining for UBE3A and NEUN in the cortex, hippocampus, and cerebellum of P30 Ube3am-/p+ mice, injected at E15.5+P1 with AAV SaCas9 vector containing neg. control gRNA (a) or Sajw33 (b). c. Zoom-in view shows UBE3A protein in neurons (NEUN+). a and b, Cortex and hippocampus, scale bar, 200 μm. cerebellum, scale bar, 100 μm. c, scale bar, 50 μm.
d-e. Western blot quantification of UBE3A levels in the cortex (cor.), hippocampus (hip.), and cerebellum (cblm.) of P30 Ube3am-/p+ (AS) mice treated with neg. control gRNA or Sajw33 (n=3 per group; dual E15.5+P1 injections). WT=wild-type mice, age P30. * P<0.05, ** P<0.01.
f-i. Representative images of hippocampus from indicated genotypes and treatments at P30 from untreated or E15.5/P1 i.c.v. injected embryos. Immunofluorescence for progenitors (TBR2), immature neurons (DCX), astrocytes (GFAP), and microglia (IBA1).
j-k. Quantification of TBR2+ (j) and IBA1+ (k) cells showed no significant difference of cell numbers in dentate gyrus among indicated genotype and treatment groups.
l. Representative images of dorsal cortices stained for microglia (IBA1) of indicated genotypes and treatments at P30. Scale bar, 100 μm.
m. Quantification of IBA1+ cells in a 200 μm column of each dorsal cortex imaged. n=3 animals per genotype with treatment with 2 imaged sections each. n.s., not significant.