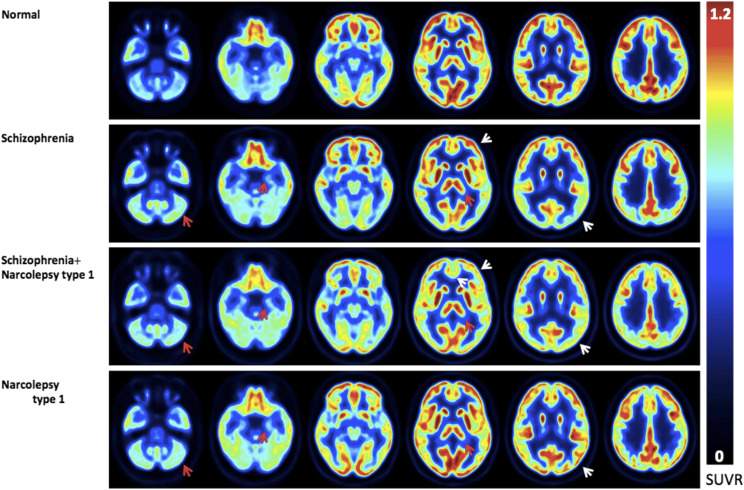
Figure 1. Standard uptake value ratio (SUVR) images.
Mean standard uptake value ratio (SUVR) of the normal control group, the schizophrenia group, the schizophrenia and narcolepsy type 1 group, and the narcolepsy type 1 group. The SUVR scale shows from dark blue, which indicates slow metabolization, to bright red, which indicates fast metabolization. Clear differences can be noted among the 4 groups.

