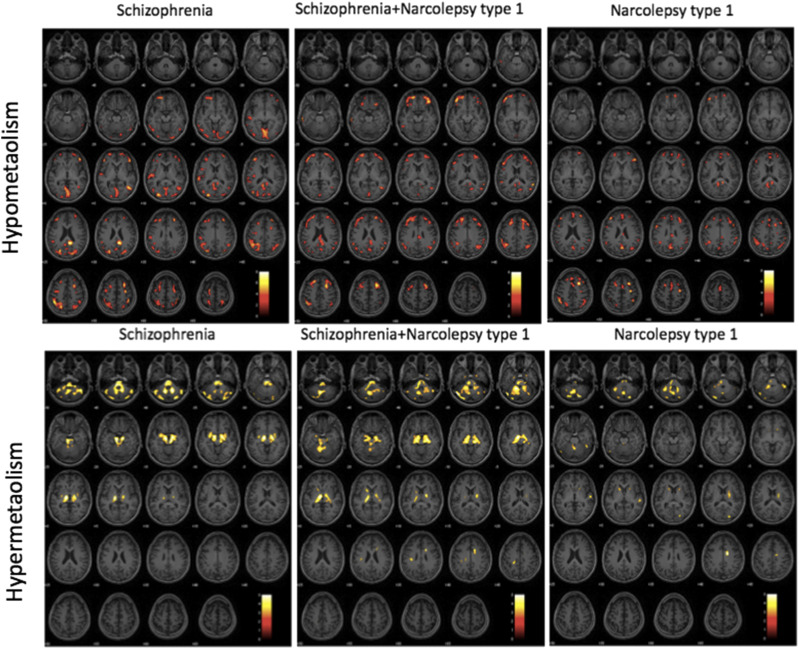
Figure 2. Hypometabolism of the schizophrenia group, the schizophrenia and narcolepsy type 1 group, and the narcolepsy type 1 group.
P < .005, extend voxel = 50, uncorrected, was selected as the threshold of statistical significance in each test. This figure shows the different hypometabolism and hypermetabolism areas between groups. Again, the differences can be clearly noted.

