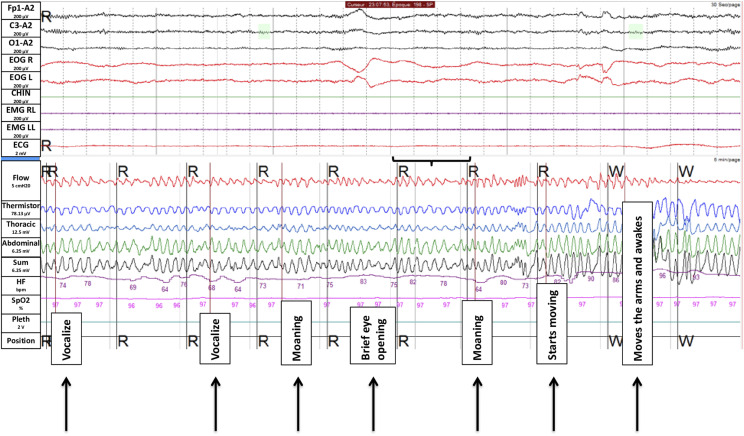
Figure 2. Polysomnography monitoring during a 5-minute episode of sleep paralysis.
The upper part of the figure displays the neurophysiological channels of a single 30-second epoch, corresponding below to the period shown in black brackets (from top to bottom; EEG channels in black color, Fp1/A2, C3/A2 and O1/; EOG right and left in red color, and EMG of the chin (green) and right and left tibialis anterior (purple); the lower part correspond to 5 min of the respiratory and heart monitoring during the full episode of sleep paralysis, with corresponding visible events in black boxes. EEG = electroencephalography, EOG = electro-oculography.

