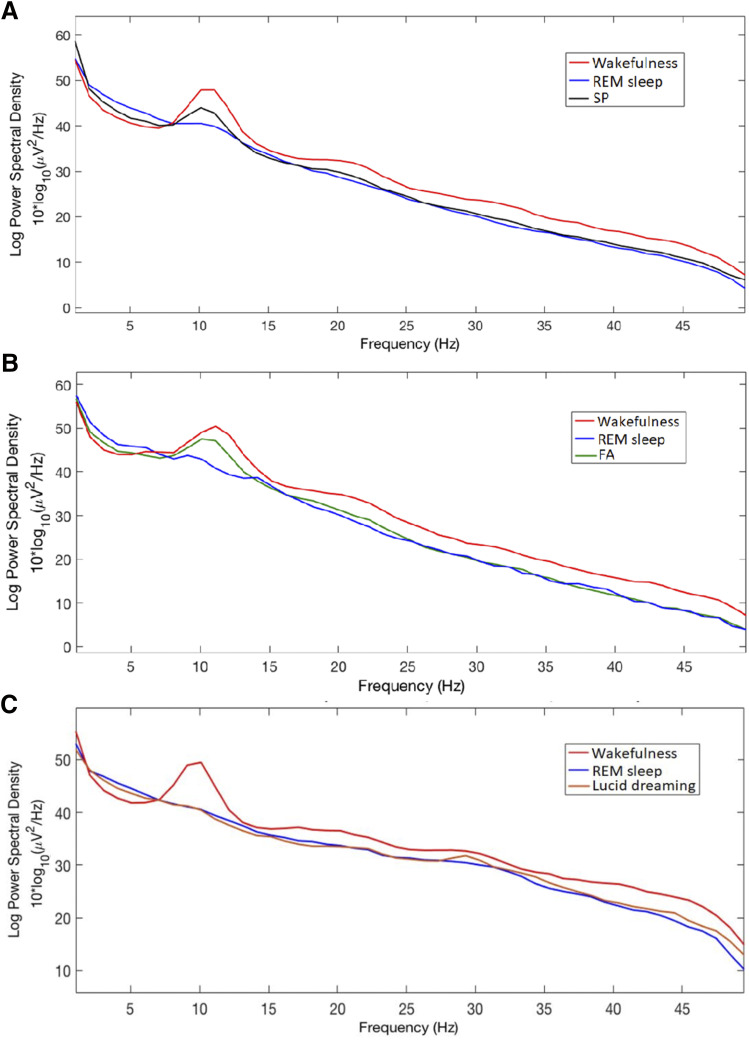
Figure 3. Global EEG power spectrum.
Global EEG power spectrum during 5 episodes of sleep paralysis (SP, black line) vs wakefulness (red line) and REM sleep (blue line) in 3 patients; during 2 episodes of false awakening (FA, green line) vs REM sleep (blue line) and wakefulness (red line) in two patients (B); during lucid REM sleep (orange line) vs REM sleep (blue line) and wakefulness (red line) in 5 other, different patients with narcolepsy (C). EEG = electroencephalography, REM = rapid eye movement.

