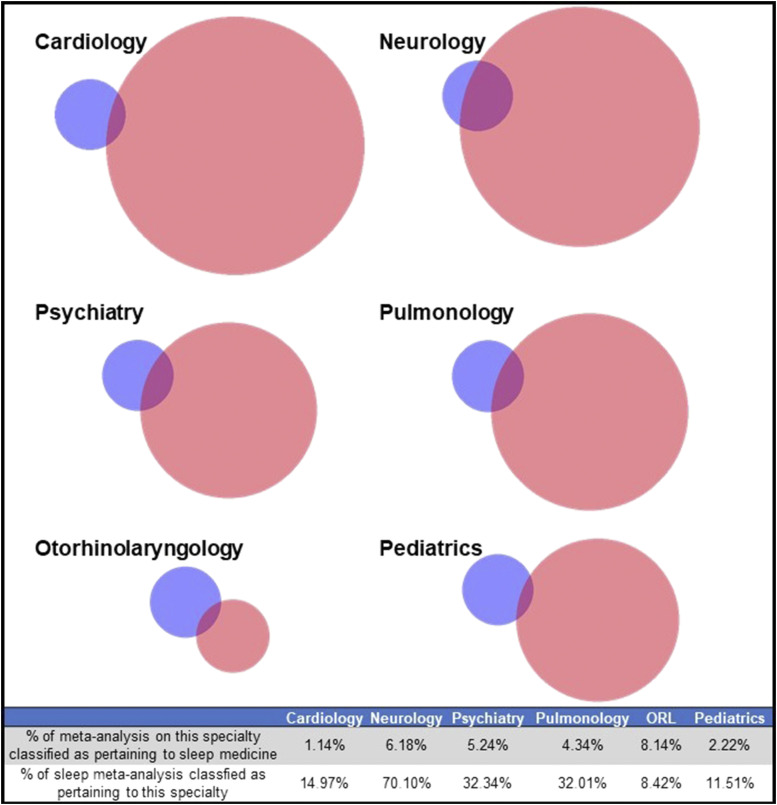
Figure 3. Venn diagrams analyzing the overlap between meta-analyses in sleep medicine and in each of the 6 analyzed medical specialties.
Blue circles represent sleep medicine, and red circles represent each of the other fields. Circle sizes are proportional to the number of meta-analyses included. No correction factor applied. Images generated using BioVenn.12

