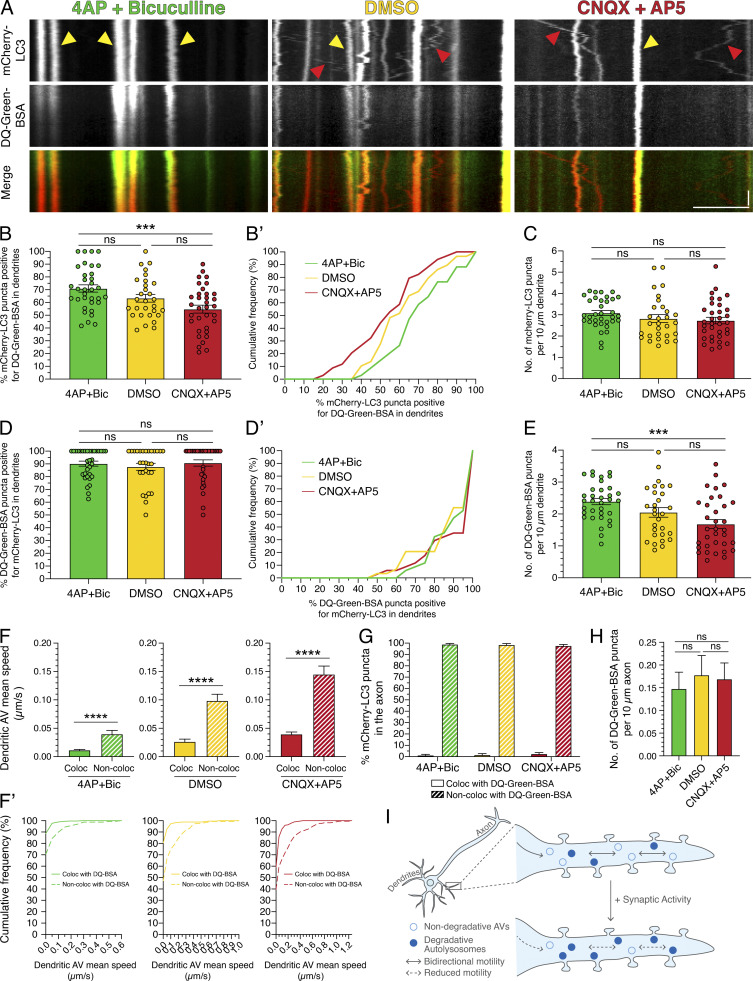
Figure 10.
Synaptic activity increases degradative AVs in dendrites. (A) Kymographs of mCherry-LC3 and DQ-Green-BSA in dendrites of rat hippocampal neurons treated with 4-AP + Bic, DMSO, or CNQX + AP5 for 30 min. Yellow arrowheads denote puncta positive for both mCherry-LC3 and DQ-Green-BSA. Red arrowheads denote puncta positive for only mCherry-LC3. Retrograde direction is from left to right. Horizontal bar, 5 µm. Vertical bar, 10 s. (B and B’) Quantitation of the percentage of mCherry-LC3 puncta positive for DQ-Green-BSA in dendrites (B, mean ± SEM; B’, cumulative frequency; n = 29–34 neurons from four independent experiments; 15 DIV; one-way ANOVA with Tukey’s post hoc test; ***, P ≤ 0.001). (C) Number of mCherry-LC3 puncta per 10-µm dendrite (mean ± SEM; n = 29–34 neurons from four independent experiments; 15 DIV; one-way ANOVA with Tukey’s post hoc test). (D and D’) Quantitation of the percentage of DQ-Green-BSA puncta positive for mCherry-LC3 in dendrites (D, mean ± SEM; D’, cumulative frequency; n = 29–34 neurons from four independent experiments; 15 DIV; one-way ANOVA with Tukey’s post hoc test). (E) Number of DQ-Green-BSA puncta per 10-µm dendrite (mean ± SEM; n = 29–34 neurons from four independent experiments; 15 DIV; one-way ANOVA with Tukey’s post hoc test; ***, P ≤ 0.001). (F and F’) Mean speed of dendritic AVs that either colocalize or do not colocalize with DQ-Green-BSA (F, mean ± SEM; F’, cumulative frequency; n = 159–354 AVs from 29–34 neurons from four independent experiments; 15 DIV; unpaired t test; ****, P ≤ 0.0001). (G) Quantitation of the percentage of mCherry-LC3 puncta that colocalize or do not colocalize with DQ-Green-BSA puncta in axons treated with 4-AP + Bic, DMSO, or CNQX + AP5 for 30 min (mean ± SEM; n = 48–62 neurons from four independent experiments; 15 DIV). (H) Quantitation of the density of DQ-Green-BSA puncta in axons treated with 4-AP + Bic, DMSO, or CNQX + AP5 for 30 min (mean ± SEM; n = 46–62 neurons from four independent experiments; 15 DIV; one-way ANOVA with Tukey’s post hoc test). (I) Model for activity-dependent regulation of autophagy in dendrites. Under basal activity, AVs exhibit bidirectional movement in dendrites. Upon stimulation of synaptic activity, AV motility is dampened, and a population of degradative autolysosomes is increased.

