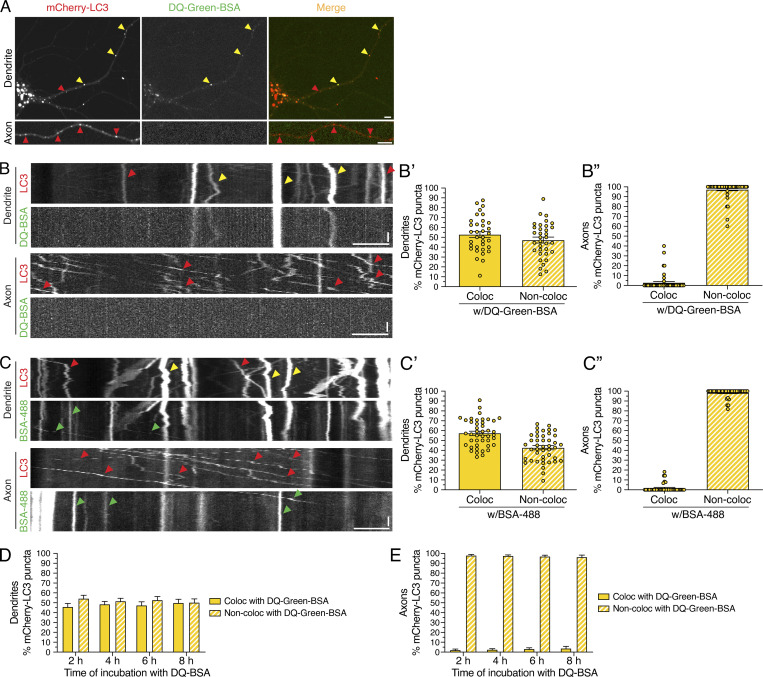
Figure 9.
Degradative AVs labeled with DQ-BSA are detected more frequently in dendrites than in axons. (A) mCherry-LC3 and DQ-Green-BSA distribution in the soma, dendrite, and axon of a hippocampal neuron. Scale bars, 5 µm. In A–C, red arrowheads denote puncta positive for only mCherry-LC3, green arrowheads denote puncta positive for only BSA (either DQ-Green-BSA or BSA-488), and yellow arrowheads denote puncta positive for both LC3 and BSA. (B) Kymographs of mCherry-LC3 and DQ-Green-BSA motility in the dendrite and axon. Retrograde direction is from left to right. Horizontal bars, 5 µm. Vertical bars, 10 s. (B’) Quantitation of the percentage of mCherry-LC3–positive puncta that colocalize (Coloc) or do not colocalize (Non-Coloc) with DQ-Green-BSA in dendrites (mean ± SEM; n = 34 neurons from three independent experiments; 13–14 DIV). (B”) Quantitation of the percentage of mCherry-LC3–positive puncta that colocalize or do not colocalize with DQ-Green-BSA in axons (mean ± SEM; n = 49 neurons from three independent experiments; 13–14 DIV). (C) Kymographs of mCherry-LC3 and BSA-488 motility in the dendrite and axon. Horizontal bar, 5 µm. Vertical bar, 10 s. (C’) Quantitation of the percentage of mCherry-LC3 puncta positive for BSA-488 in dendrites (mean ± SEM; n = 43 hippocampal neurons from four independent experiments; 13 DIV). (C”) Quantitation of the percentage of mCherry-LC3 puncta positive for BSA-488 in axons (mean ± SEM; n = 40 hippocampal neurons from four independent experiments; 13 DIV). (D) Quantitation of the percentage of mCherry-LC3 AVs that are copositive for DQ-Green-BSA in dendrites as a function of time of incubation with DQ-BSA (mean ± SEM; n = 25–28 neurons from three independent experiments; 13 DIV). (E) Quantitation of the percentage of mCherry-LC3 AVs that are copositive for DQ-Green-BSA in axons as a function of time of incubation with DQ-BSA (mean ± SEM; n = 24–30 neurons from three independent experiments; 13 DIV).

