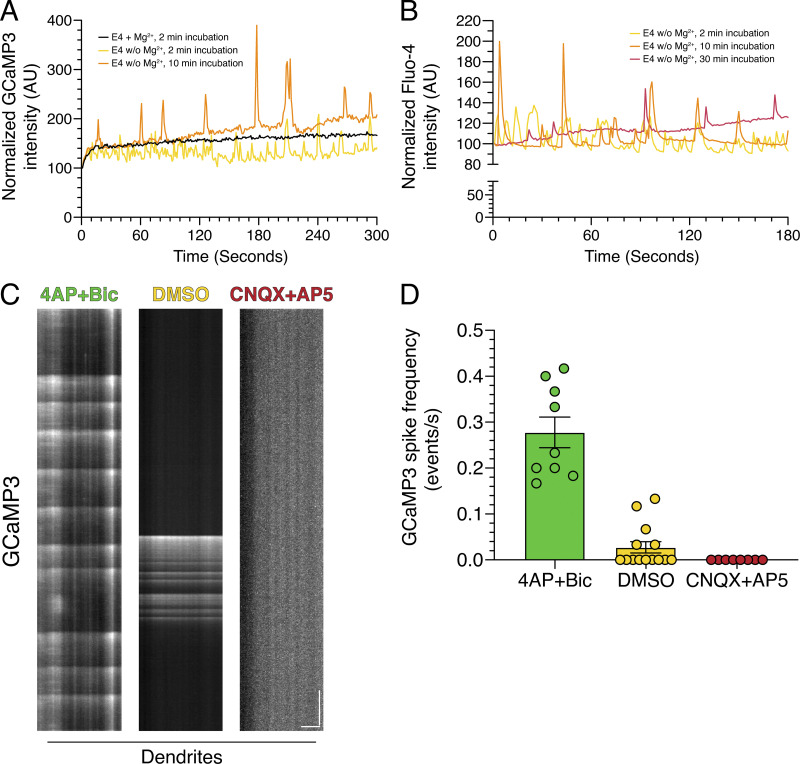
Figure S2.
Quantitation of calcium oscillations in rat hippocampal neurons. (A) Quantitation of mean GCaMP3 fluorescence in an individual neuron (14 DIV) as a function of time of incubation in E4 solution. (B) Quantitation of mean Fluo-4 fluorescence in a field of neurons (13 DIV) as a function of time of incubation in E4 solution. (C and D) High-speed imaging of GCaMP3 oscillations in dendrites from hippocampal neurons treated with 4-AP + Bic, DMSO, or CNQX + AP5 for 30 min. (C) Kymograph analysis of GCaMP3 in dendrites. Horizontal bar, 5 µm. Vertical bar, 5 s. (D) Corresponding quantitation of GCaMP3 spike frequency (mean ± SEM; n = 8–14 neurons from two independent experiments; 13–14 DIV).

