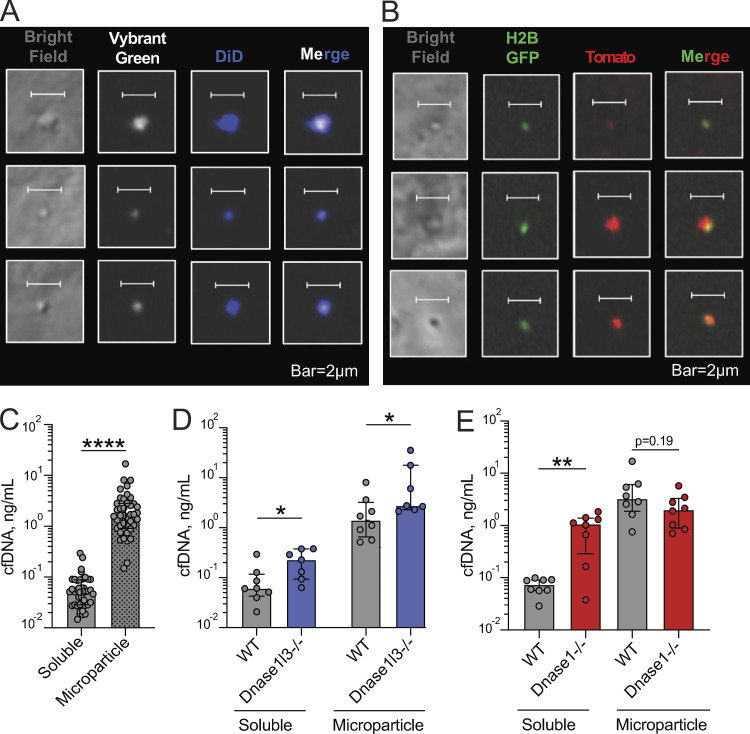
Figure 4.
DNASE1L3-mediated control of MP DNA is conserved in the mouse. (A) DNA-carrying MPs from the plasma of WT mice. MPs were stained with Vybrant DyeCycle Green for DNA (white) and Vybrant DiD for membrane (blue) and examined by confocal microscopy. Representative of three independent experiments. Scale bars, 2 µm. (B) Chromatin in plasma MPs visualized using genetically encoded fluorescent probes. MPs were isolated from the plasma of mice expressing a H2B-GFP fusion and membrane-targeted red fluorescent protein tdTomato and examined by confocal microscopy. Representative of two independent experiments. Scale bars, 2 µm. (C) Distribution of cfDNA in the plasma of WT mice. Shown are concentrations per original plasma volume of cfDNA in the MP fraction and in the MP-depleted (soluble) fraction of WT mice (n = 42). Symbols represent individual mice, and bars represent median ± interquartile range. Statistical significance was determined by Mann–Whitney test; ****, P < 0.0001 (two tailed). (D) Distribution of cfDNA in the plasma of age- and sex-matched WT and Dnase1l3-deficient mice. Shown are concentrations per original plasma volume of cfDNA in the MP fraction and in the MP-depleted (soluble) fraction of WT (n = 8) and Dnase1l3-deficient (n = 7) mice. Symbols represent individual mice, and bars represent median ± interquartile range. Statistical significance was determined by Mann–Whitney test; *, P < 0.05 (two tailed). (E) Distribution of cfDNA in the plasma of age- and sex-matched WT and Dnase1-deficient mice. Shown are concentrations per original plasma volume of cfDNA in the MP fraction and in the MP-depleted (soluble) fraction of WT (n = 8) and Dnase1-deficient (n = 8) mice. Symbols represent individual mice, and bars represent median ± interquartile range. Statistical significance was determined by Mann–Whitney test; **, P < 0.01 (two tailed).

