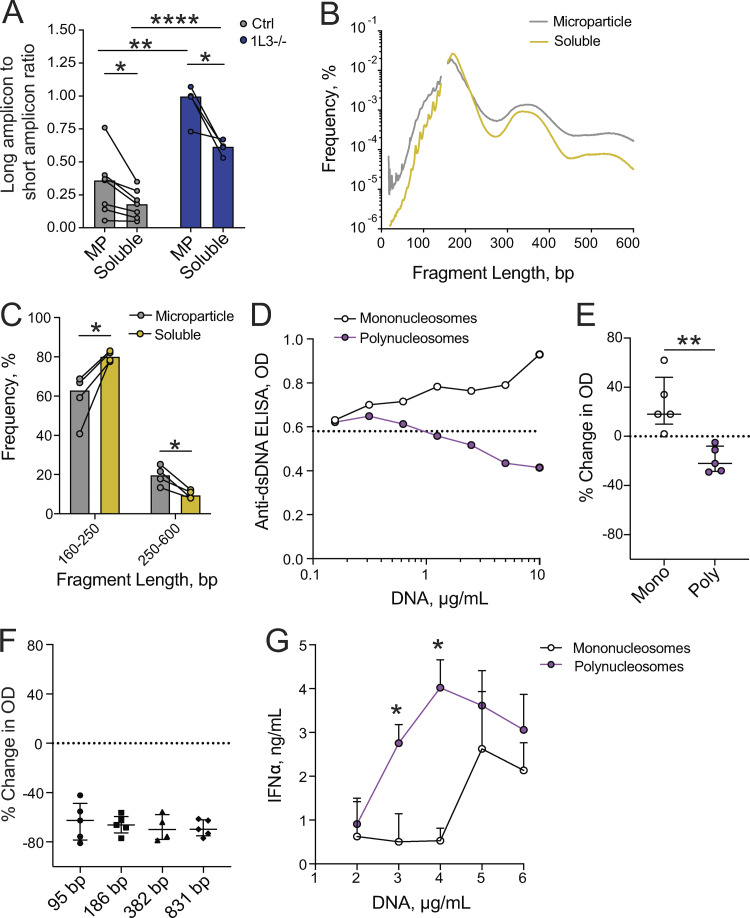
Figure 5.
MPs carry longer polynucleosomal fragments with better antigenic properties. (A) Average length of cfDNA in the MP and MP-depleted (soluble) fractions of plasma from healthy controls (Ctrl; gray, n = 7) and DNASE1L3-deficient patients (1L3−/−; blue, n = 4) as determined by long to short amplicon ratio. Symbols represent individual subjects; bars represent mean. Unpaired samples (Ctrl versus 1L3−/−) were compared using unpaired Student's t test, and paired samples (MP versus soluble) were compared using paired Student's t test; *, P < 0.05; **, P < 0.01; ****, P < 0.0001 (two tailed). (B) Size distribution of cfDNA fragments in the MP (gray) and MP-depleted (soluble, gold) fractions of plasma from healthy controls as determined by sequencing. Lines represents averages of four healthy controls. (C) Fraction of cfDNA fragments of the indicated length ranges in the MP and MP-depleted (soluble) fractions of plasma from healthy controls as determined by sequencing. Symbols represent individual healthy subjects; bars represent mean. Samples were compared using paired Student's t test; *, P < 0.05 (two tailed). (D and E) The effect of chromatin size on binding to anti-dsDNA Abs in a competition assay using plasma of an SLE patient. D shows a representative titration of polynucleosomes (purple) and mononucleosomes (white); dashed line shows binding in the absence of competitor DNA. E shows the inhibition of binding by anti-dsDNA IgG from different SLE patients (n = 5) at the maximum inhibitor concentration (10 µg/ml). Symbols represent individual plasma samples, and bars represent median ± interquartile range. Statistical significance was determined by Mann–Whitney test; **, P < 0.01 (two tailed). (F) Inhibitory capacity of protein-free DNA fragments of the indicated lengths in bp on the binding by anti-dsDNA IgG at the maximum inhibitor concentration (10 µg/ml). Symbols represent individual SLE patients (n = 5), and bars represent median ± interquartile range. (G) The effect of chromatin size on interferon production by pDCs. Mononucleosomes (white) or polynucleosomes (purple) were incubated with antimicrobial peptide LL-37 and used to stimulate pDCs from healthy donors, and IFN-α was measured by ELISA after 24 h. Each point represents an average of two healthy donors, and bars represent SD of the mean. Data are representative of two independent experiments. Statistical significance was determined by Mann–Whitney test; *, P < 0.05 (two tailed).

