Figure 6.
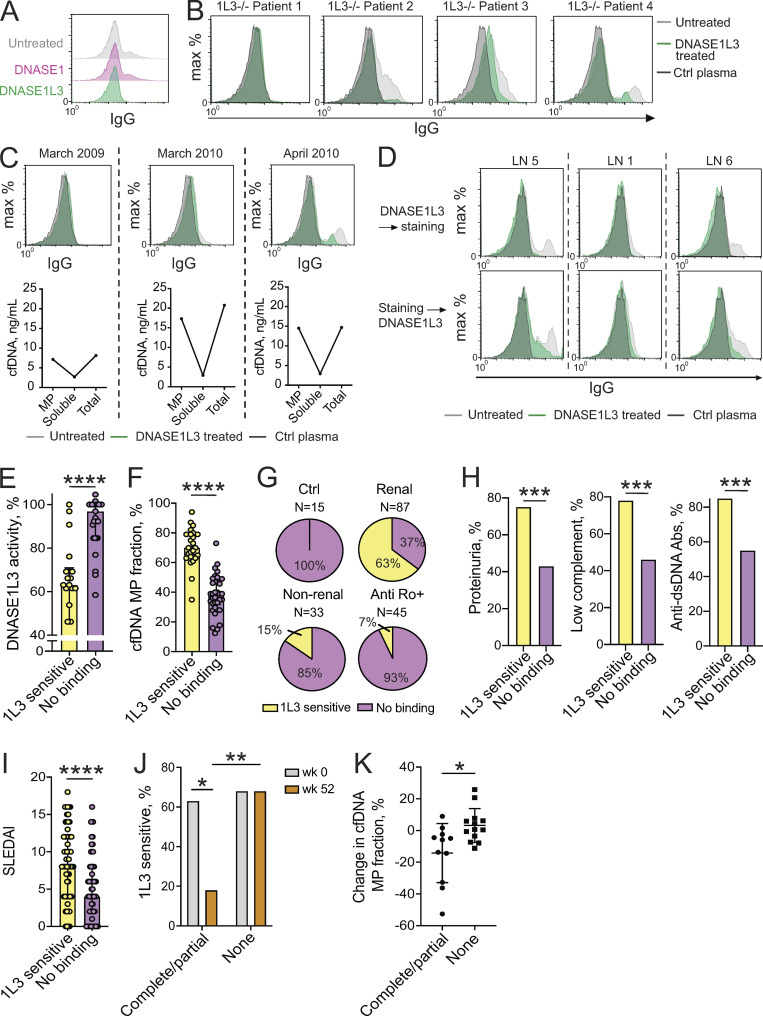
Reactivity to DNASE1L3-sensitive MP Ags is associated with reduced DNASE1L3 activity and renal SLE. (A–D) Auto-Ab binding to DNASE1L3-sensitive Ags on MPs. MPs from apoptotic Jurkat cells that were untreated or treated with human DNASE1 or DNASE1L3 were incubated with plasma from SLE patients or healthy control (Ctrl) plasma followed by anti-human IgG conjugates. (A) Histograms of IgG fluorescence using plasma from a SLE patient; representative of three independent experiments. (B) MP staining by plasma from patients with genetic DNASE1L3 deficiency (1L3−/−, n = 4) or from a healthy control (Ctrl). (C) MP binding by IgG from plasma of a DNASE1L3-deficient patient (patient 4 from B) who suffered a severe disease flare with renal failure in May 2010. Top row shows histograms of plasma IgG binding to MPs at the indicated dates. Bottom panel shows the concentration of cfDNA in MPs, the MP-depleted (soluble) plasma fraction, and total plasma at each date. (D) Auto-Ab binding to DNASE1L3-sensitive MP Ags in sporadic SLE patients with LN. Jurkat cell–derived MPs were treated with DNASE1L3 and stained with plasma (top row) or stained first and subsequently treated with DNASE1L3 (bottom row). Shown are representative histograms of IgG fluorescence in three LN patients with reduced DNASE1L3 activity and anti-DNASE1L3 Abs. (E) Relative DNASE1L3 activity in SLE patients with (n = 22) or without (n = 29) reactivity to DNASE1L3 (1L3)–sensitive Ags on MPs. Symbols represent individual patients, and bars represent median ± interquartile range. Statistical significance was determined by Mann–Whitney test; ****, P values < 0.0001 (two tailed). (F) The fraction of MP-associated cfDNA in sporadic SLE patients with (n = 25) or without (n = 34) reactivity to DNASE1L3-sensitive Ags on MPs. Symbols represent individual patients, and bars represent median ± interquartile range. Statistical significance was determined by Mann–Whitney test; ****, P < 0.0001 (two tailed). (G) Reactivity to DNASE1L3-sensitive Ags on MPs in the indicated patient groups. (H) Frequency of the indicated SLEDAI criteria in SLE patients (combined renal and nonrenal) with (n = 61) or without (n = 59) reactivity to DNASE1L3 (1L3)-sensitive Ags on MP. Fisher’s exact test was used to prepare contingency tables between the two groups; ***, P < 0.001 (two tailed). (I) SLEDAI index in renal and nonrenal SLE patients with (n = 61) or without (n = 59) reactivity to DNASE1L3 (1L3)-sensitive Ags on MPs. Symbols represent individual patients, and bars represent median ± interquartile range. Statistical significance was determined by Mann–Whitney test; ****, P < 0.0001 (two tailed). (J) Reactivity to DNASE1L3-sensitive Ags on MP in LN patients depending on treatment response. Shown is the percent of patients with DNASE1L3 (1L3)–sensitive IgG binding to MPs at baseline (week 0, gray) and after 52 wk of treatment (week 52, orange) for patients with complete (n = 8)/partial (n = 3) treatment response versus no response (n = 19). Fisher’s exact test was used to prepare contingency tables between the two groups; *, P < 0.05; **, P < 0.01 (two tailed). (K) Change in the fraction of MP-associated cfDNA in LN patients with a complete (n = 8)/partial (n = 3) or no treatment response (n = 13) at baseline and after 52 wk of treatment. Symbols represent individual subjects; bars represent mean ± SD. Statistical significance was determined by Mann–Whitney test; *, P < 0.05 (two tailed).

