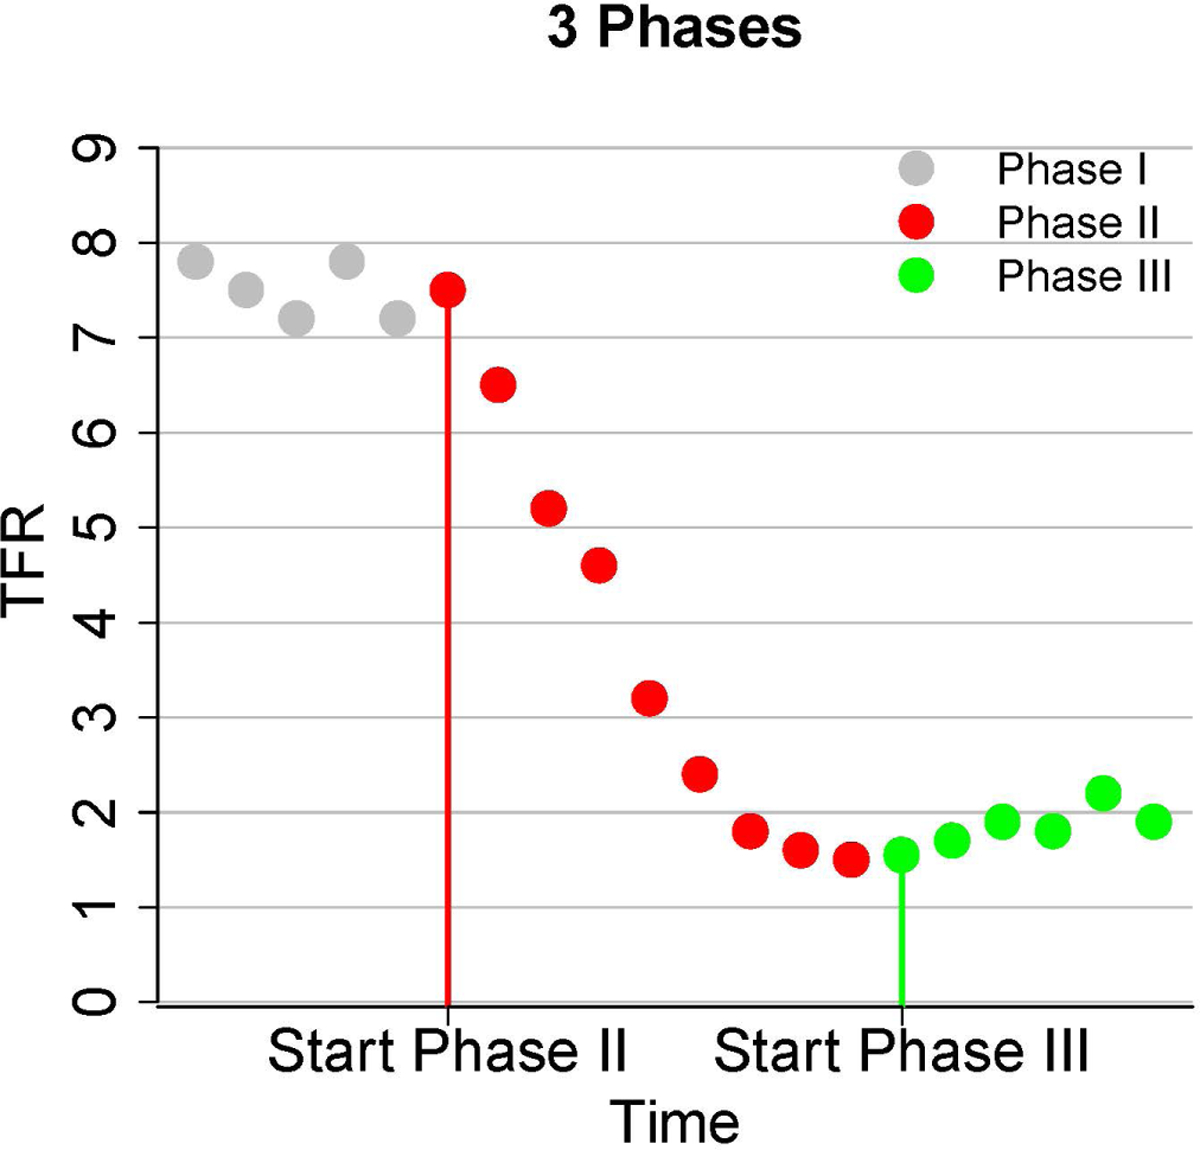
Fig 1.

Illustration of the three phases in the typical evolution of fertility in a country: pre-transition high fertility (Phase I; grey), transition from high to low fertility — (Phase II; red), and post-transition fertility fluctuations and recovery (Phase III; green).
