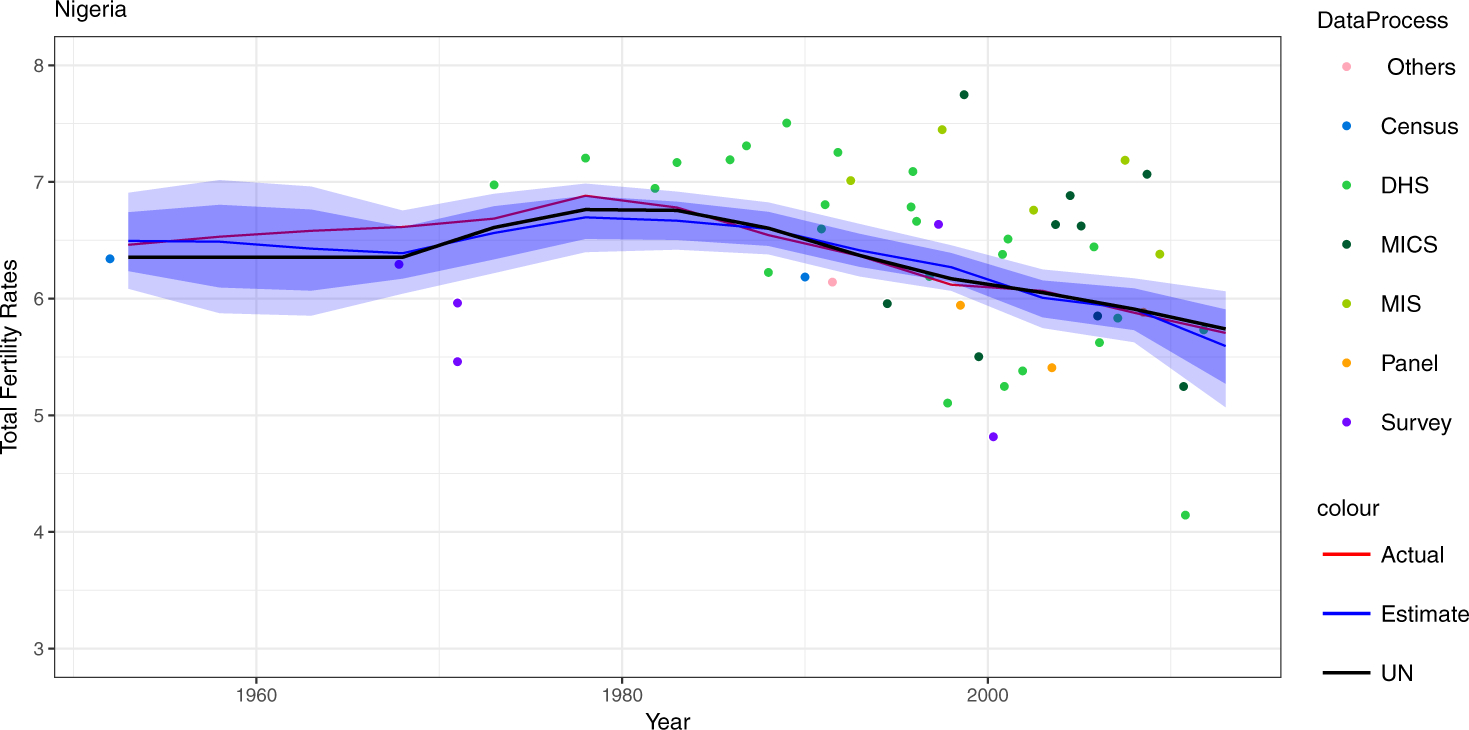
Fig 8.

Past and Present TFR Estimates for Nigeria. Colored dots are simulated observations. The red curve is the assumed true TFR, which is assumed unobserved and the black line is the UN estimate. Shaded areas are 95% estimation intervals based on the simulated observations.
