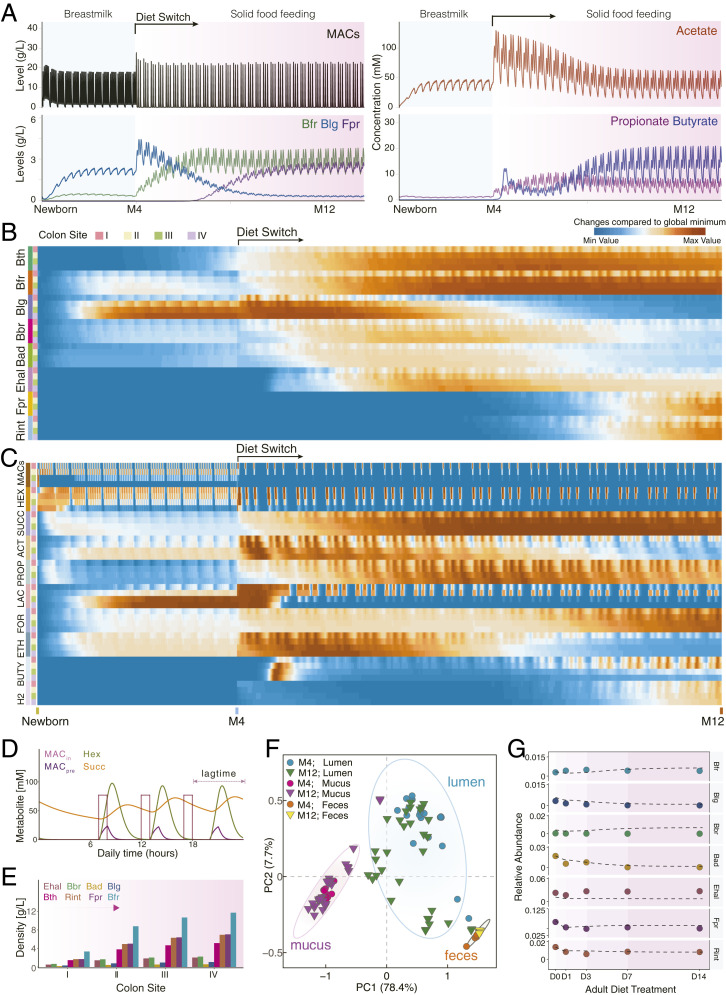
Fig. 4.
CODY output shows quantitative predictions on how exogenous factors shape dynamic in vivo biogeographic-specific microbial variations within different colon regions, as well as in vitro plasma metabolic shift in response to the diet intervention. (A) Line plot shows the in vivo dynamic profiles of selective species and metabolites (MACs, acetate, butyrate, and propionate) in response to diet switch from breastmilk to solid food in ascending lumen compartment. (B) Heat maps show the biogeographic-specific microbiota changes along longitudinal luminal colon regions from newborn to 12th month. Each four rows denote one bacterium, annotated by colored bars on the left of the heat map. Colon site annotations: I, ascending; II, transverse;, III, descending; IV, sigmoid. (C) Heat maps show the biogeographic specific metabolite changes along longitudinal luminal colon regions. Each four rows denote one metabolite; a total of 10 metabolites are shown. Hex, hexose; Succ, succinate; Act, acetate; Prop, propionate; Lac, lactate; For, formate; Eth, ethanol; Buty, butyrate; H2, hydrogen. (D) Line plots show the CODY output associated with human digestion transit time, as the lag phase shown with time difference between model diet input under real-life scenario (MACin) and model output of selected metabolites in the ascending lumen region (carbohydrate, hexose, and succinate). Metabolite annotation: MACin, diet input; MACpre, model prediction of feeding diet; Hex, hexose; Succ, succinate. (E) Bar plots show CODY output associated with model predictions of biogeographic-specific microbial abundance profiles within the in vitro colon site-specific regions in the longitudinal direction. Model output is shown on the poststabilized microbial configurations during solid-food feeding period. (F) Identification of biogeographic heterogeneity by performing principle component analysis with the hctsa toolbox (SI Appendix, Supplementary Method 9) on the CODY output of model predictions of dynamic microbial abundance profiles that are distributed along the longitudinal direction, i.e., the dynamic development trajectories of microbes residing within the ascending, transverse, sigmoid, and descending colon regions associated with the luminal/mucus compartments, as well as the dynamic microbial development in the feces compartments. (G) Evaluation of CODY output with respect to model predictions on the poststabilized microbial abundance profiles in the feces compartment by comparing model predictions and metagenomics measurements across the time-series scales during short-term diet-restriction treatment for the hepatic steatosis adult patients, i.e., 0, 1, 3, 7, and 14 d after diet intervention. Lines are shown for CODY predictions on the time-coursed microbiota dynamic variations. Symbols are shown for representing metagenomics measurements at 0, 1, 3, 7, and 14 d after diet intervention.

