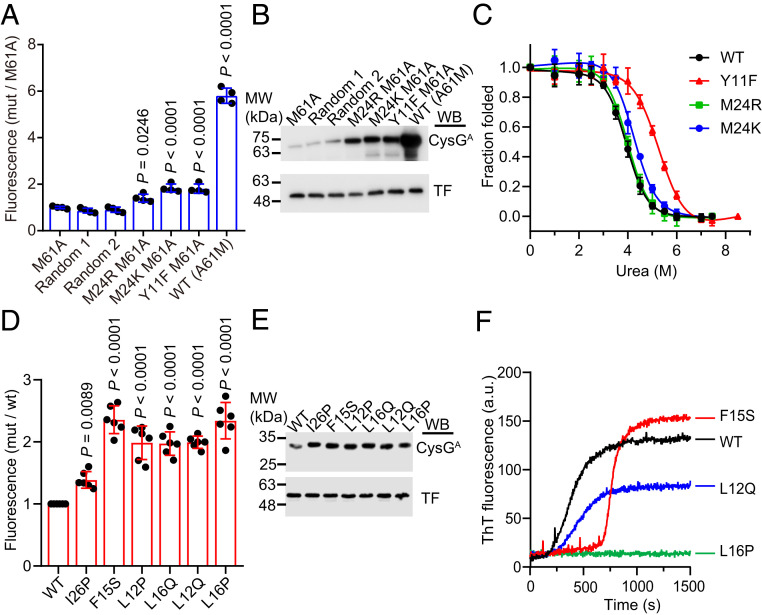
Fig. 3.
Stabilization of AcP and human IAPP. (A) Relative fluorescence intensities of cells expressing CysGA fused with the indicated AcP mutants. A solubility-enhancing MBP tag was fused to the N terminus of CysGA-AcP fusions to facilitate their detection. Fluorescence intensities were normalized to that of cells expressing the CysGA fused with AcPM61A. Two randomly picked, unselected strains showed fluorescence similar to that of the unmutated control strain, indicating that the small but significant increase in fluorescence of our selected strains was not a stochastic event. (B) Soluble expression levels of CysGA fused with different AcP mutants. Soluble fractions of the cell lysates were analyzed by immunoblotting with antibodies against CysGA and a trigger factor (TF) protein that served as a loading control. (C) Equilibrium urea-induced unfolding of wild-type AcP and screened variants. The raw titration data were converted to the fraction of folded proteins. Equilibrium unfolding parameters of different AcP variants were determined via fitting of the denaturation curves to the equation as described in Materials and Methods. (D) Relative fluorescence intensities of cells expressing CysGA fused with different IAPP variants. All selected variants emitted stronger florescence intensities than the strain expressing CysGA fused with IAPPI26P, which was previously reported to display relatively weak aggregation. (E) Soluble expression levels of CysGA fused with different IAPP variants. (F) Thioflavin T assays for the previously uncharacterized IAPP mutants. Amyloid formation of IAPP was detected by measuring the fluorescence at an excitation wavelength of 440 nm and an emission wavelength of 485 nm. Data are the mean ± SD of four (A), three (C), or five (D) independent measurements. P values were determined by one-way ANOVA with a Dunnett’s multiple comparison test. Representative blots from three independent experiments are shown (B and E). One representative curve from three independent measurements is shown for each mutant (F). Uncropped Western blots are presented in SI Appendix, Fig. S12.

