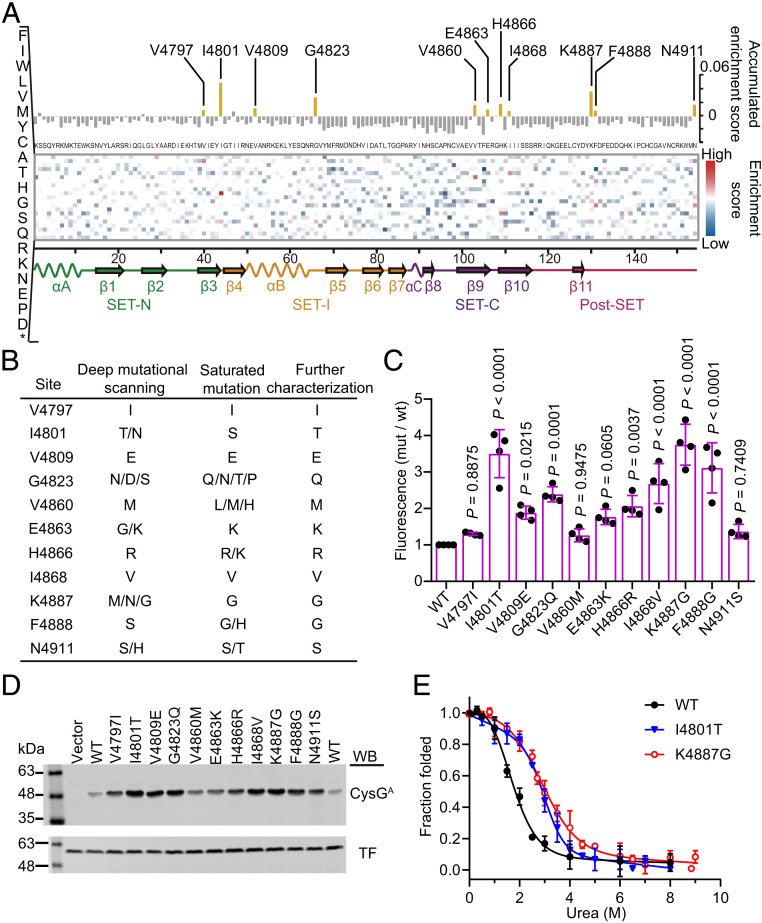
Fig. 5.
The sequence-stability landscape of the MLL3SET protein. (A) Heat map of the enrichment scores for every observed amino acid substitution with the value for the accumulated enrichment score along the top, all possible mutations on the left axis, and the secondary structure elements displayed across the bottom. Unexamined amino acids and wild-type residues are colored in white. (B) Mutations enriched in the deep mutational scanning and identified from the saturation libraries. (C) Relative fluorescence intensities of cells expressing various fusion proteins inserted with the selected MLL3SET mutant variants. The fluorescence intensity of cells was normalized relative to cells expressing CysGA fused with wild-type MLL3SET. Data are the mean ± SD of four independent experiments. P values were determined by one-way ANOVA analysis with a Dunnett’s multiple comparison test. (D) Soluble expression level of the fusion protein containing the selected MLL3SET mutants. The soluble fraction of cell lysates was analyzed by immunoblotting with antibodies against CysGA and trigger factor (TF) protein that served as a loading control. The experiment was independently performed at least three times with similar results each time. Uncropped Western blots are presented in SI Appendix, Fig. S13. (E) Equilibrium urea-induced unfolding of wild-type MLL3SET and the selected variants. Data are the mean ± SD of three independent experiments.

