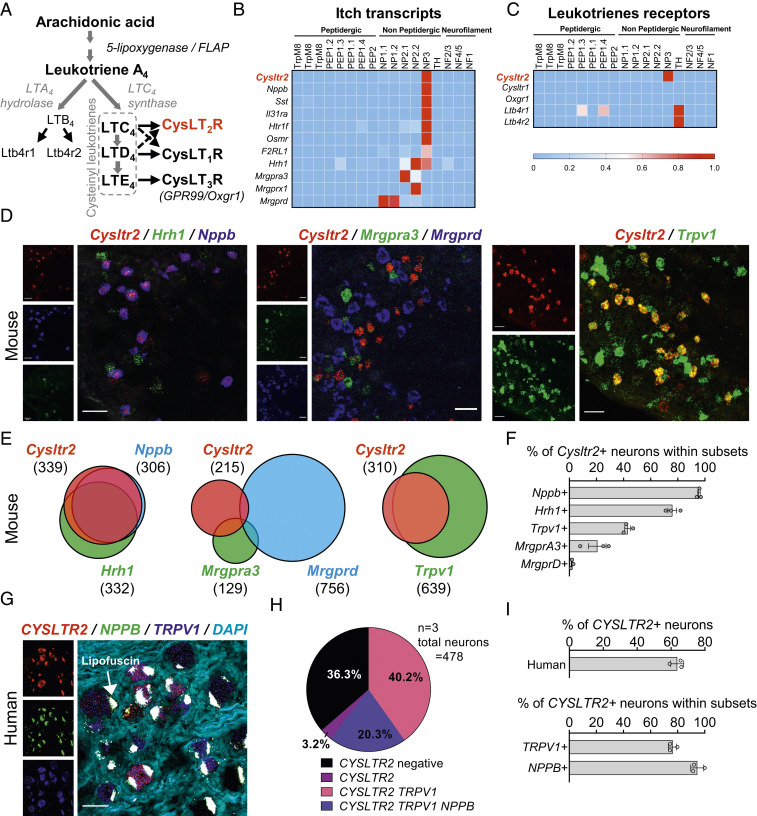
Fig. 1.
Cysltr2 is expressed on a subset of DRG sensory neurons. (A) Diagram of the LT pathway. (B and C) Expression of selected transcripts (B, related to itch; C, LT receptors) in mouse DRG neuron populations clustered into functional subsets based on single-cell RNA-seq data. Full dataset and methods are available in a previous study (32). (D) Triple/double-label ISH done with RNAscope in DRG (Left, Cysltr2, red; Nppb, blue; Hrh1, green; Middle, Cysltr2, red; MrgprA3, green; Mrgprd, blue; Right, Cysltr2, red; Trpv1, green). (Scale bar: 50 µm.) (E and F) ISH quantification: (E) Venn diagram representing overlap between markers and (F) percentages of Cysltr2+ neurons within subsets defined by other markers (n = 3 mice). (G) Representative images of human DRG labeled with RNAscope ISH for CYSLTR2 (red), NPPB (green), and TRPV1 (blue) and costained with DAPI (cyan). Lipofuscin (globular structures) that autofluoresced in all three channels and appear white in the overlay image were not analyzed, as this is background signal that is present in all human nervous tissue. (Scale bar: 50 μm.) (H) Pie chart displaying the distribution of CYSLTR2 neuronal subpopulations in human DRG. (I) Percentage of all human sensory neurons expressing CYSLTR2 transcript (Top) and of TRPV1 neurons and NPPB neurons coexpressing CYSLTR2 (Bottom). Values presented as mean ± SEM.

