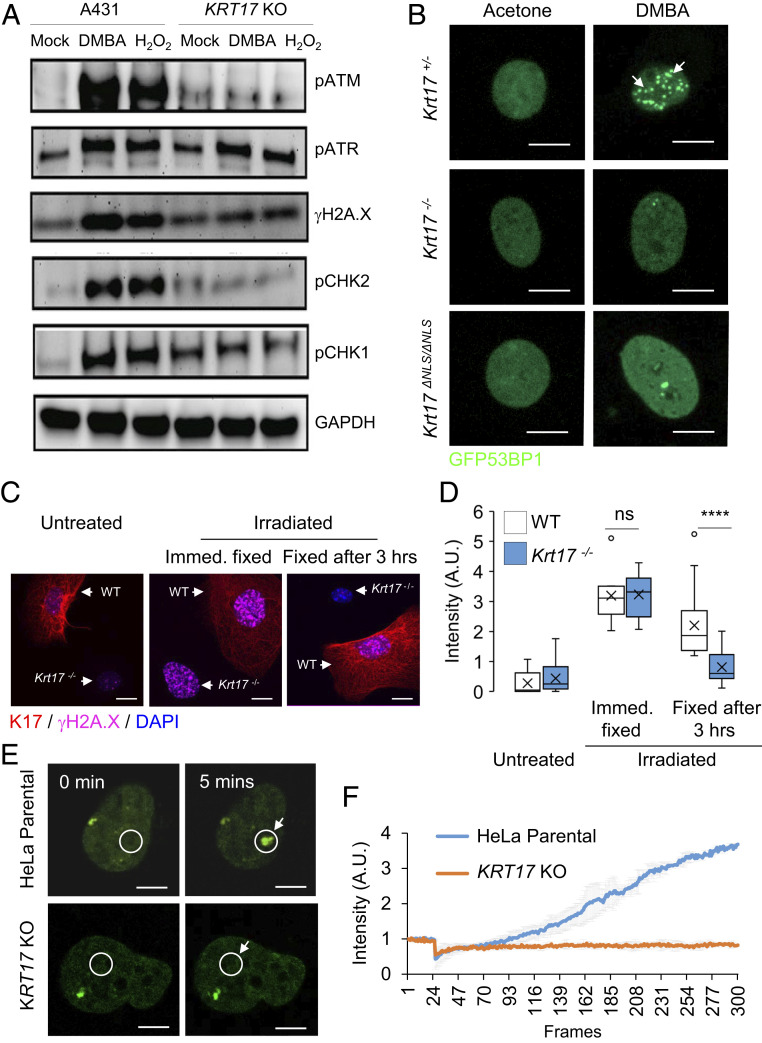
Fig. 3.
K17 impacts the regulation of key DNA damage response effectors. (A) K17 impacts the canonical DNA damage response pathway. Western blot analysis on total protein extracts from A431 parental and KRT17 KO cells for DDR-associated signaling proteins. (B) Mouse keratinocytes isolated from newborn pups, Krt17+/−, Krt17−/−, and Krt17ΔNLS/ΔNLS, were transfected with the GFP-53BP1 construct and treated with 1 μg of DMBA (12 h). Cells were fixed and imaged for 53BP1 foci formation. GFP-53BP1 is in green. Krt17+/− cells showed foci formation of 53BP1 post damage. (Scale bars: 10 μm.) n = 3 replicates. (C) Mouse keratinocytes isolated from WT and Krt17−/− newborn pups were mixed together and treated with 5 Gy X-ray irradiation and fixed either immediately or after 3 h to immunostain for γH2A.X. In the representative confocal images (maximum projection image of z stacks) K17 is red, γH2A.X is magenta, and DAPI is blue. Each representative image shows a single field containing both Krt17 expressing cell (red filament staining) and Krt17−/− cell (DAPI alone, no red filament staining). (Scale bars: 20 μm.) (D) Signal intensities of γH2A.X staining from Fig. 1C were quantified using ImageJ and Excel. Error bars are SEM. n = 3 replicates. (E) 53BP1 recruitment in response to laser-induced DSB visualized through live cell imaging requires K17. HeLa parental and KRT17 KO cells were transfected with the GFP-53BP1 construct and imaged under live conditions using a Zeiss LSM880 microscope. A 405-nm laser was used to create DSB at an ROI (white circle) and monitored for GFP-53BP1 foci formation during a course of 5 min. The Top shows the nucleus of a parental HeLa cell, and Bottom shows the nucleus of a HeLa KRT17 KO cell. (Scale bars: 5 μm.) (F) Signal intensities at the ROI during time lapse imaging represented in Fig. 1E were quantified using ImageJ and Excel for the graph. Error bars are SD for measurements across three single cell nuclei per genotype. White arrows in B, C, and E draw attention to area of interest. ns P > 0.05 and ****P < 0.0001.

