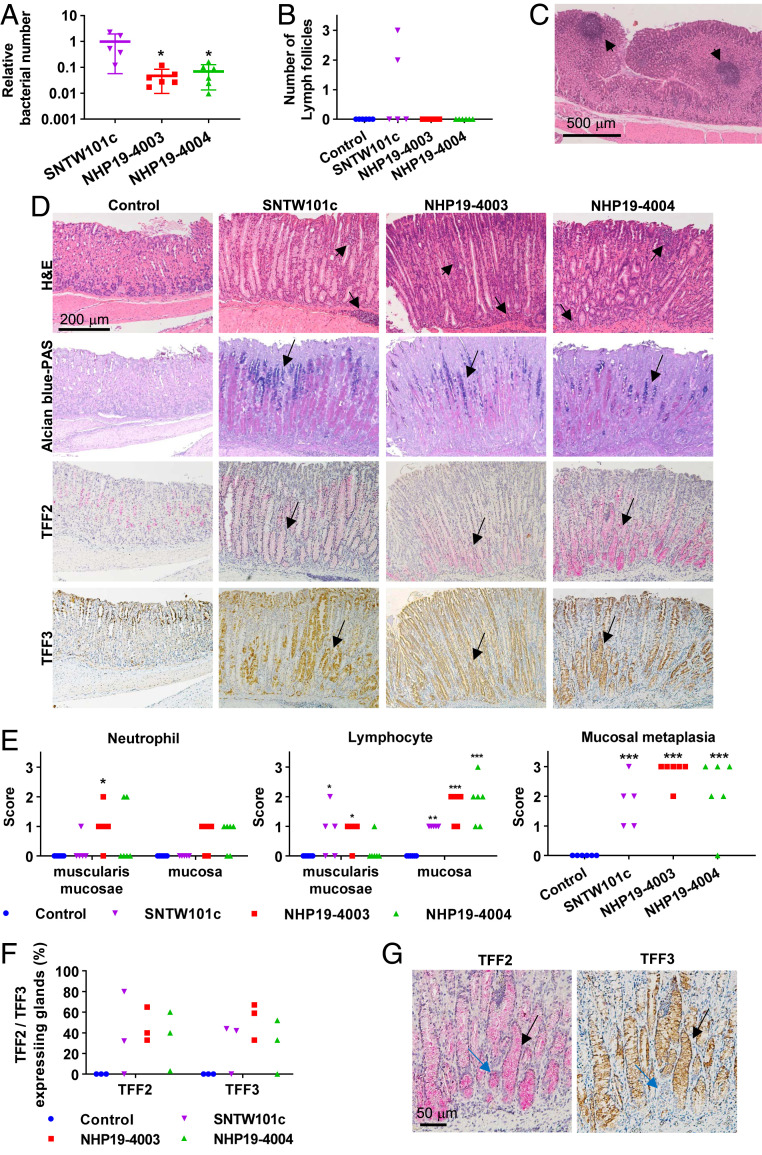
Fig. 3.
Effects of H. suis infection in mice. (A) Relative bacterial number of H. suis in the mouse stomach. Bars indicate means ± SD. (B) Number of lymph follicles observed in stomach sections from H. suis–infected and control mice. (C) H&E staining of a lymph follicle (arrows) observed in mice infected with H. suis SNTW101c. (D) H&E, Alcian blue–PAS, TFF2, and TFF3 staining of stomach sections from H. suis–infected and control mice. Lymphocyte infiltration in mucosa and muscularis mucosae (arrows) was observed in H. suis–infected mice. Acidic mucus, stained blue with Alcian blue–PAS (arrows), was observed in H. suis–infected mice. Expression of TFF2 and TFF3 was observed at the bases of glands (arrows) in H. suis–infected mice. (E) Scoring of neutrophil and lymphocyte infiltration in muscularis mucosae and mucosa and mucosal metaplasia of stomach sections from H. suis–infected and control mice. Bars indicate means ± SD. (F) Percentage of glands expressing TFF2 or TFF3 in H. suis–infected and control mice. (G) TFF2- or TFF3-expressing glands of stomach from H. suis NHP19-4004–infected mice. Most glands expressed both TFF2 and TFF3 (black arrows), and rare glands (blue arrows) expressed only TFF2. In each of the H. suis–infected samples, the relative bacterial number of H. suis in the stomach of NHP19-4003– or NHP19-4004–infected mice was compared with that of SNTW101c–infected mice by one-way ANOVA with Dunnett’s test. Scores for cell infiltration observed in stomach sections in H. suis–infected mice were compared with those in control mice by two-way ANOVA with Sidak’s multiple comparisons test. Numbers of lymph follicles and scores for mucosal metaplasia in H. suis–infected mice were compared with those in controls by one-way ANOVA with Holm–Sidak’s multiple comparisons test. *P < 0.05, **P < 0.01, ***P < 0.001.

