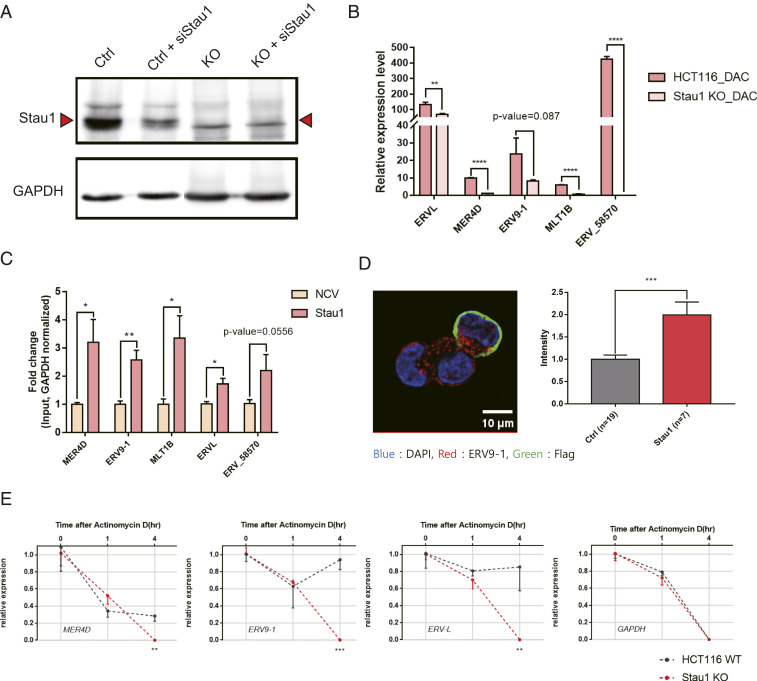
Fig. 3.
Analysis of Stau1 KO cells reveals the stabilization of ERV RNAs by Stau1. (A) The Stau1 KO HCT116 cell is generated by targeting the exon 7 of Stau1 using CRISPR. Western blot analysis shows the elimination of the Stau1 band in the lysates from the KO cells. (B) Compared to the parental cells, Stau1 KO cells showed decreased levels of ERV RNAs when treated with decitabine. n = 3 and error bars denote SEM. (C) Overexpression of Stau1 in the KO cells resulted in increased expression of all ERVs examined. NCV indicates the transfection of the blank vector. (D) Increased expression of ERV9-1 RNA was also validated through RNA-FISH image analysis. Stau1-expressing cells were identified by staining cells with the Flag antibody, shown in green. Quantified fluorescent signals are shown on the Right. n = 19 (Ctrl), n = 7 (Stau1), and error bars denote SEM. (E) ERV RNA expression changes after treating parental and KO cells with ActD. n = 3 and error bars denote SEM. *P value <0.05, **P value <0.01, ***P value <0.001, ****P value <0.0001.

