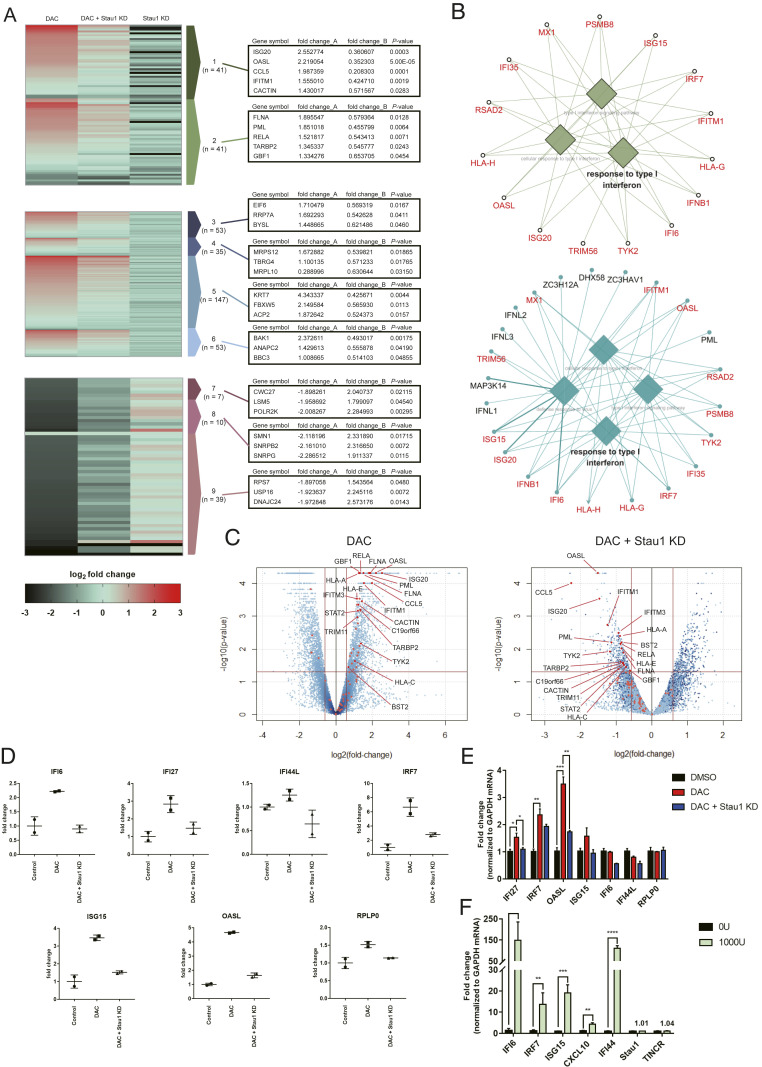
Fig. 4.
Stau1 can regulate the immune response by decitabine. (A) Heatmap of total RNA sequencing results. The first column is the RNA expression ratio of siLuc+decitabine/siLuc+DMSO, the second column is the RNA expression ratio of siStau1+decitabine/siLuc+DMSO, and the third column is the RNA expression ratio of siStau1+DMSO/siLuc+DMSO. Fold_change_A indicates the expression change of the first column while fold_change_B denotes the expression change of the second column normalized by the first column (siStau1+decitabine/siLuc+decitabine). P values of the fold_change_B are shown in the third column. Cluster 1: related to immune, cluster 2: response to virus, cluster 3: ribosome biogenesis, cluster 4: mitochondrial gene expression, cluster 5: mitotic cell cycle, cluster 6: mitochondrial transport, cluster 7: protein localization to the endoplasmic reticulum, cluster 8: mRNA splicing, and cluster 9: translation. (B) GO of top 300 up-regulated genes after decitabine treatment (Top) and top 500 down-regulated genes in Stau1-deficient cells (Bottom). Overlapping genes are marked in red. (C) Volcano plot of the sequencing data with immune response-related genes indicated in red. The Left plot shows the RNA expression change by decitabine treatment, while the Right plot shows the RNA expression change in Stau1-deficient cells. (D) The RNA expression level of several ISGs in the total RNA-seq result. (E) Validation of the ISG expressions using RT-qPCR. n = 3 and error bars denote SEM. (F) Treating the cells with IFN-β did not affect the expression of Stau1 and TINCR. n = 3 and error bars denote SEM. *P value <0.05, **P value <0.01, ***P value <0.001, ****P value <0.0001.

