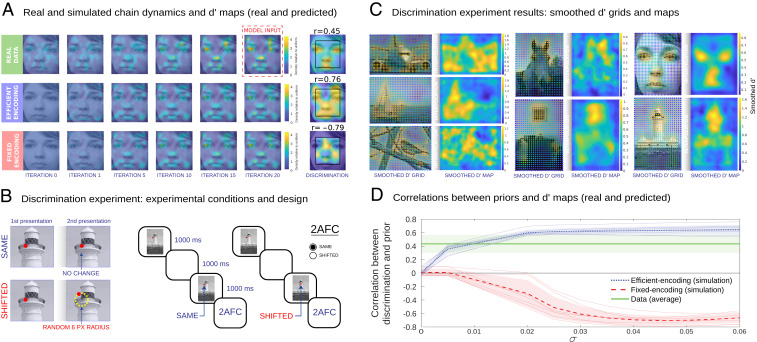
Fig. 3.
Visuospatial memory distortions correspond to variable encoding precision. (A) Representative example of real and simulated chain dynamics and discrimination maps (face image). Real and simulated KDEs are shown for iterations 0, 1, 5, 10, 15, and 20. Both the efficient and fixed encoding models provide good approximations to the real transmission chain data (SI Appendix, Fig. S8). Real and simulated discrimination accuracy maps are also shown, including correlations to the prior. (B) Discrimination experiment conditions and experimental design. Discrimination points were obtained from a regular two-dimensional (2D) grid of points over the image. In the same condition, the red dot did not change position in the second presentation. In the shifted condition, the red dot was shifted to a point located in a random position at a six-pixel radius distance from the original position. Two identical images were shown for 1,000 ms sequentially with a red dot placed on top of them. The dot was either in the same location in both cases (same condition) or shifted (shifted condition). Both the dot and the image were shifted by a random offset in the second presentation in both conditions. The starting points were sampled from a 2D grid of possible points over the image. (C) Discrimination results for natural images. Discrimination values for each grid point were convolved with a Gaussian kernel, and final maps were computed through cubic interpolation of the smoothed grid values. (D) Correlations between priors and discrimination (natural images). For each noise magnitude , we computed the correlation predicted by the two models. The correlations were positive (blue line) for the efficient encoding model and negative (red line) for the fixed encoding model. Thin lines show data for individual natural images; error bars show SDs across images. The green line shows the mean and SD of the correlations of the empirical data and the priors. We exclude the edges of the images because the fixed encoding model produces predictions with noticeable edge artifacts resulting in slightly smaller correlations than the ones we report. The fixed encoding model also predicts smaller variation in across the images (SI Appendix, Fig. S8). The data support the efficient encoding model.

